

Tag: bonds
Asset Allocation Bi-Weekly – #158 “Are Long-Term Treasurys No Longer a Safe Haven?” (Posted 3/16/26)
Asset Allocation Bi-Weekly – Are Long-Term Treasurys No Longer a Safe Haven? (March 16, 2026)
by Patrick Fearon-Hernandez, CFA | PDF
Historically, major geopolitical or economic crises, such as the war against Iran, have prompted investors to sell riskier assets and buy “safe-haven” investments whose values were expected to remain stable or even rise amid the disruptions. The most popular safe havens have been the US dollar, gold, and longer-term US Treasury obligations. Faced with the crisis, or the prospect of one, investors would typically bid up the value of the dollar versus other currencies. Many would also avidly buy up gold, driving prices for the precious metal upward. Others would snap up Treasurys, boosting their values and pushing their yields down. However, market action so far during the Iran war has defied expectations. Treasury demand has been relatively muted, and yields have been markedly resilient. This raises the question of whether long-term Treasurys are still a safe haven. And if not, why?
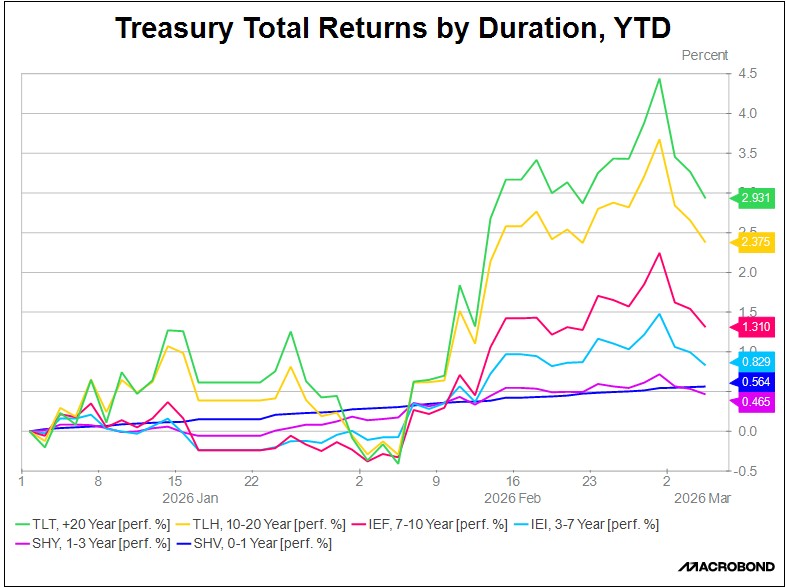
One way to see the unusual performance of long Treasurys is to compare their recent total returns versus shorter-term Treasurys. In the chart above, we show the total return (price change plus interest) for exchange-traded funds (ETFs) tracking Treasury obligations maturing in 20+ years (TLT), 10-20 years (TLH), 7-10 years (IEF), 3-7 years (IEI), 1-3 years (SHY), and 0-1 year (SHV). The graph shows how Treasurys of all tenors were bid up starting in mid-February, when it became clear that the US was prepping for a potential strike against Iran. However, once the war started, investors sold off Treasurys. The selling was especially strong for long-duration obligations as investors began to realize that the conflict could be more drawn out than anticipated, driving up global energy prices and rekindling consumer price inflation.
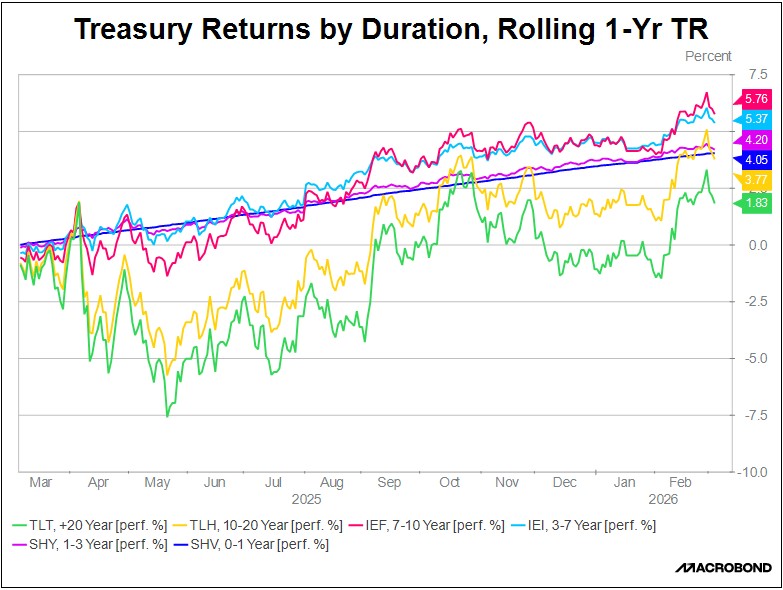
Importantly, the outsized selling of long Treasurys came after a protracted period of weak returns. The chart above displays Treasury total returns by duration over rolling one-year periods. It shows clearly how one-year returns from long Treasurys have lagged since early 2025.
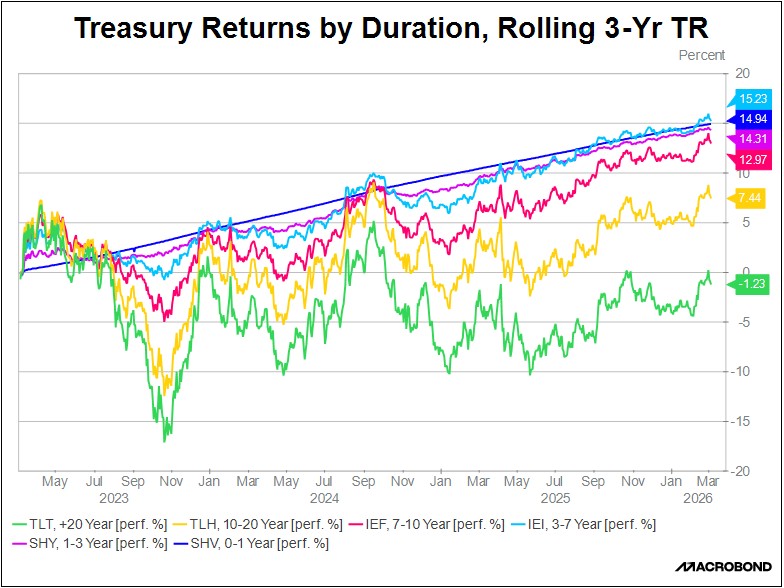
Indeed, long-term Treasury returns have lagged for quite some time. The final chart, on the next page, shows that three-year returns for long Treasurys have not only lagged shorter-term Treasury returns, but they have also lost money in the latest three-year period. This happened even though the Federal Reserve has been cutting its benchmark fed funds interest rate since September 2025. In contrast, shorter-term Treasury securities have offered steady positive returns. Shorter-term Treasurys have largely held their value even after the Iran war started and it became clear that the conflict would threaten global energy supplies and risk reigniting inflation.
Why have long Treasurys lost their attraction as a safe haven? We believe their weakness reflects increased investor concerns about US fiscal dynamics, prospects for a more politicized Fed, and fear of currency debasement. The key evidence for this has been the sell-off in long Treasurys after the war started, once it became clear that the conflict could last long enough to seriously disrupt energy supplies and cause rising global inflation. If investors were truly confident that the Fed would temporarily hike interest rates as needed to wring the inflation out of the economy and protect the purchasing power of the dollar, then demand for Treasurys should have gotten a boost from wartime safe-haven buying. However, the fact that Treasurys have not behaved as usual suggests they may have lost a lot of their cache as a safe haven. As investors also sell off gold to cover margin requirements and raise needed cash, it seems like they only see one true safe-haven asset these days, i.e., cash.
Don’t miss our accompanying podcasts, available on our website and most podcast platforms: Apple | Spotify
Confluence of Ideas – #47 “Reviewing the Asset Allocation Rebalance: Q1 2026” (Posted 2/18/26)
Confluence of Ideas – #45 “Reviewing the Asset Allocation Rebalance: Q4 2025” (Posted 11/3/25)
Asset Allocation Bi-Weekly – #148 “Stopping the Bond Vigilante: How Fiscal Dominance Is Reshaping Global Markets” (Posted 9/22/25)
Asset Allocation Bi-Weekly – Stopping the Bond Vigilante: How Fiscal Dominance Is Reshaping Global Markets (September 22, 2025)
by Thomas Wash | PDF
The bond bull market that began in the early 1980s lasted nearly four decades. Its longevity was largely built on the assumption that governments would always prioritize the health of their bond markets, even if it meant imposing economic pain on their own countries. This thinking fostered the legend of the “bond vigilante” — a mythical force that would supposedly punish irresponsible government spending by selling off bonds, thereby holding policymakers in check.
The bond market’s core assumption — that it would curb government overspending — has been severely tested since the pandemic. The initial, one-time surge in borrowing was necessary to prevent a global economic collapse. However, that precedent has been exploited. Many governments now use debt to finance a variety of pet projects, from infrastructure and green initiatives to energy subsidies and tax cuts. This increase in spending, detached from any corresponding increase in tax revenue or spending cuts, has been the primary driver behind the recent increase in bond yields around the world (see chart below).
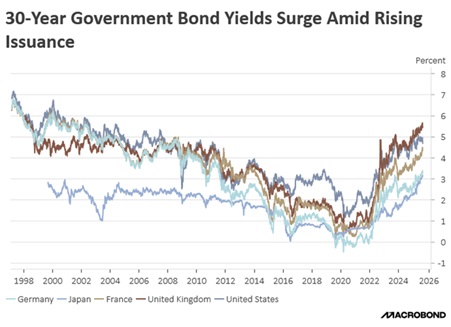
A primary focus of attention is the potential for a supply/demand imbalance in the bond market. The concern is that rising bond issuance is occurring simultaneously, with a shift in investor preferences toward short-duration bonds driven by growing anxieties about inflation, economic growth, and central bank policy. As a result of this mismatch, yields on 30-year government bonds globally have risen to their highest level in over 20 years. This rise in sovereign bond yields is largely attributable to growing concerns over US credit quality, triggered by Moody’s Ratings’ decision to downgrade the US credit rating from Aaa to Aa1 on May 16. The agency justified its move by highlighting the US government’s perceived unwillingness to address deteriorating fiscal conditions, specifically citing structurally large annual deficits and escalating debt servicing costs.
These concerns were compounded by a poorly received 20-year Treasury auction on May 21, which served as an immediate test of market confidence. The auction results were weak, and yields rose above 5% for the first time since October 2023. Although not the sole driver, this weak auction amplified selling pressure across the yield curve, with the 30-year yield surpassing 5%.
Concerns about the US government’s credit quality have also raised fears about the creditworthiness of other developed countries. In the same month that the US had its weak bond auction, Japan also experienced poor demand for a 30-year bond offering. Furthermore, yields have risen across Europe and in the United Kingdom, driven by concerns that these countries may struggle to meet their own budget targets.
On the supply side, although interest rates remain elevated, governments are taking proactive measures to mitigate their impact on the broader economy. Notably, the US, Japan, and the UK have begun increasing their issuance of shorter-duration sovereign bonds. This strategy aims to reduce supply pressure on longer-dated bonds, which helps to curb the rise in long-term borrowing costs. Meanwhile, France is in a debt standoff as it looks to address its budget situation through a combination of spending cuts and tax increases.
On the demand side, most central banks are actively adjusting their strategies to ensure liquidity in the bond market. The Federal Reserve, Bank of England, and Bank of Japan have all focused on modifying the pace of their balance sheet reduction to add liquidity back into the system. While the ECB has not formally stated its intention to use its tools to help bring down yields, particularly in France, it has expressed a willingness to do so through its Transmission Protection Instrument in case of a crisis.
While rising government debt remains a problem, it appears that, at least in the short to medium term, governments have the ability to prevent yields from rising to very high levels. The trade-off is that governments worldwide may remain vulnerable to rollover risk when short-term bonds expire. This could force them to take more proactive measures to prevent rates from destabilizing the economy.
We believe the need to mitigate these fiscal risks could pressure governments into a regime of fiscal dominance, where monetary policy is subordinated to keep public debt servicing costs manageable. A key feature of this environment would be central banks tolerating higher inflation, effectively abandoning their strict price stability and leading to structurally elevated price pressures. In such a scenario, a barbell bond strategy — favoring both short-term and long-term bonds while avoiding the middle of the yield curve — could be advantageous in the near to medium term. Furthermore, peripheral European countries that have demonstrated a credible commitment to fiscal sustainability could become particularly attractive investment opportunities for those seeking international exposure.