by Bill O’Grady, Thomas Wash, and Patrick Fearon-Hernandez, CFA | PDF
(N.B. Due to the Thanksgiving Day holiday, the next report will be published on December 3.)
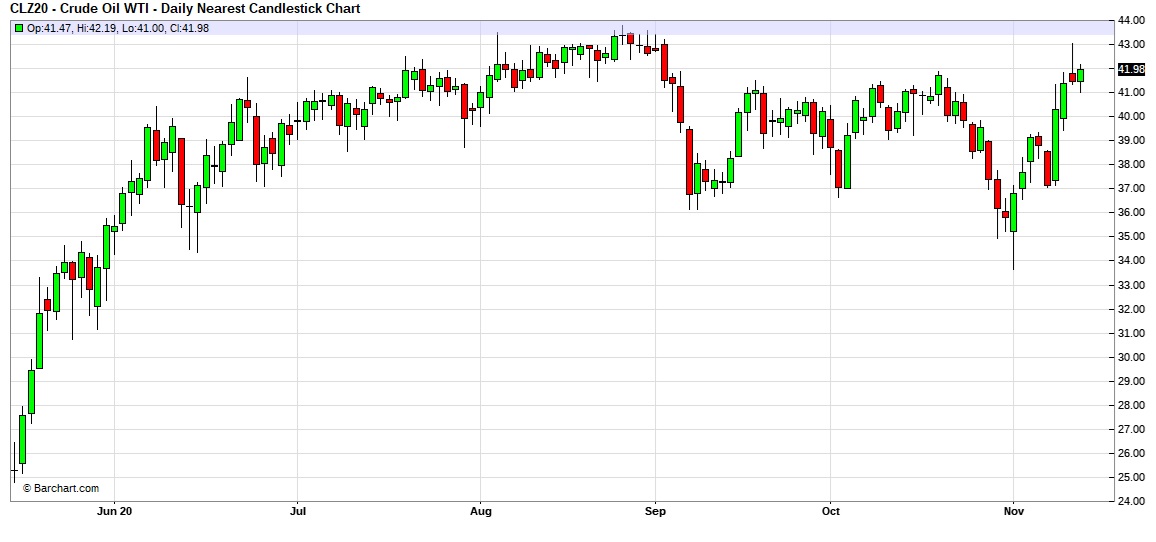
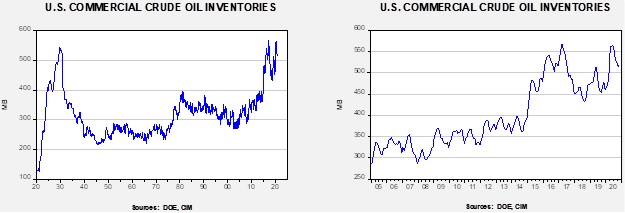
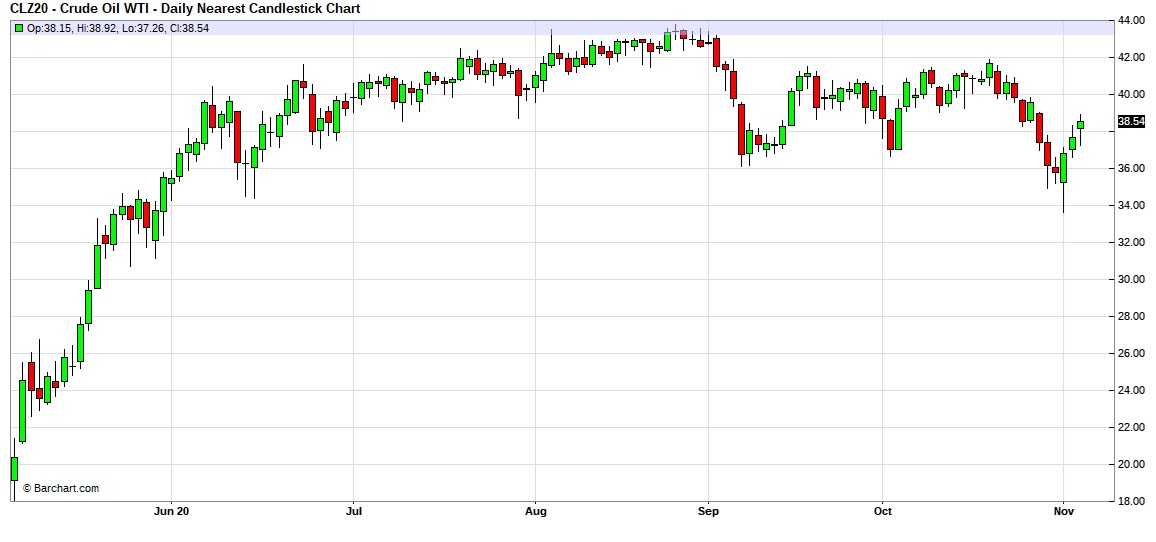
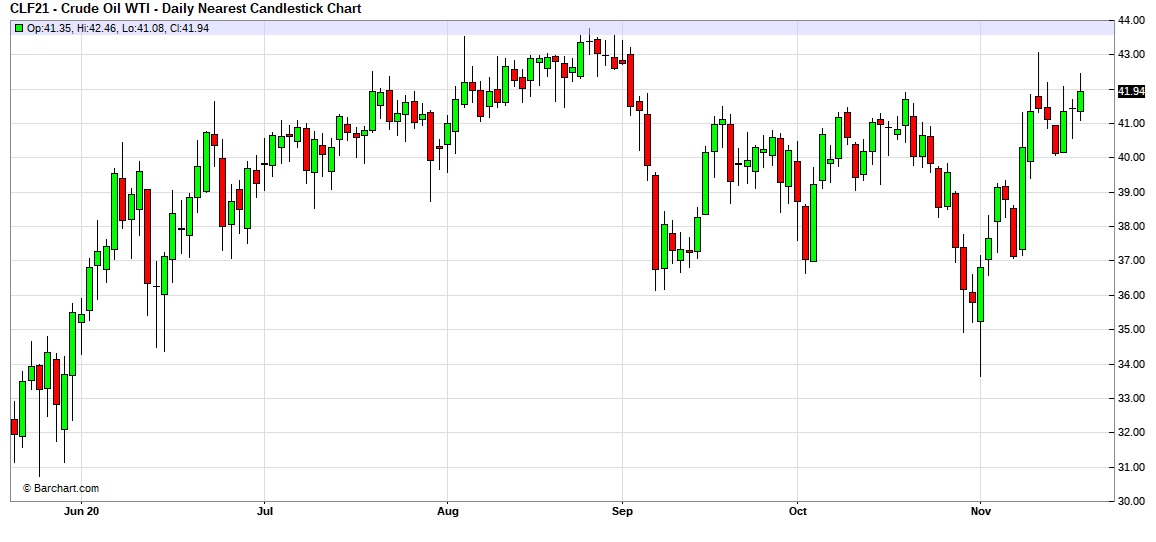
Here is an updated crude oil price chart. Positive news on a vaccine for COVID-19 led to a strong rally this week, taking prices to the upper end of the current trading range.
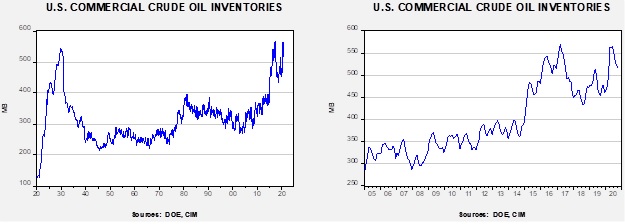
Commercial crude oil inventories rose 0.8 mb when a 1.6 mb draw was expected. The SPR declined 0.4 mb; since peaking at 656.1 mb in July, the SPR has drawn 17.7 mb. Given levels in April, we expect that another 4.7 mb will be withdrawn as this oil was placed in the SPR for temporary storage. Taking the SPR into account, storage rose 0.4 mb. The data was mostly unaffected by tropical activity this week.

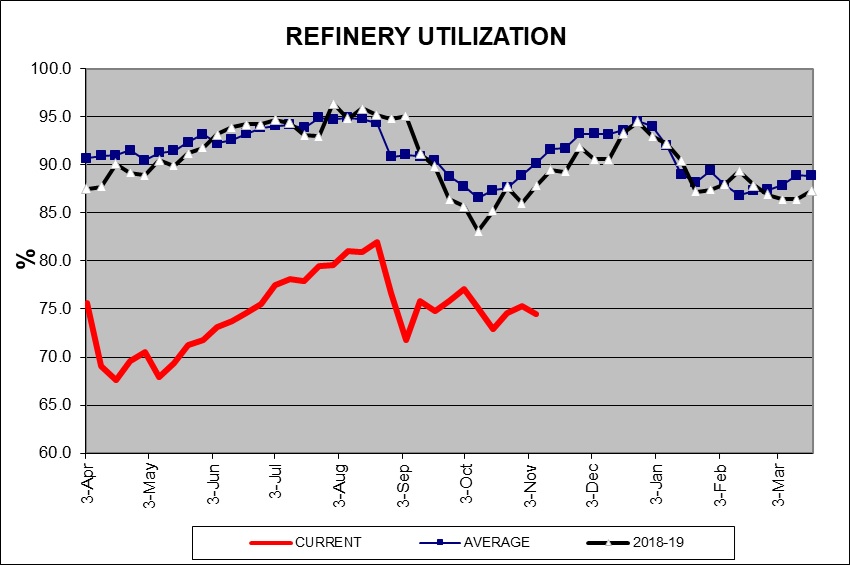
In the details, U.S. crude oil production rose 0.4 mbpd to 10.9 mbpd. Exports were unchanged, while imports fell 0.2 mbpd. Refining activity rose 2.9%.
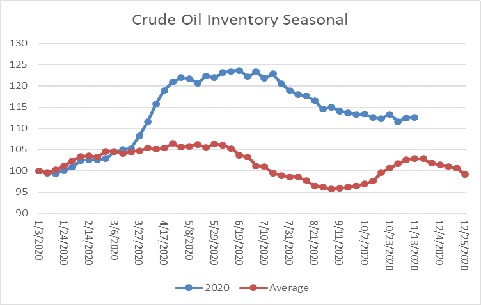
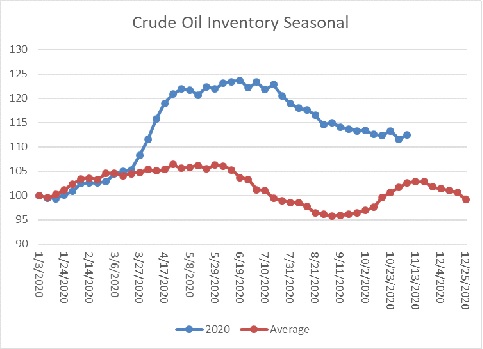
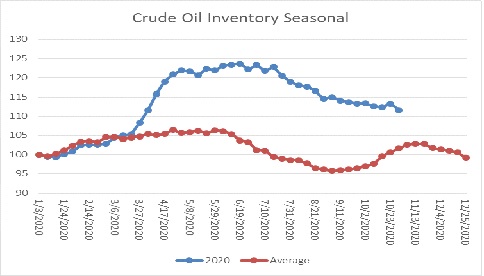
The above chart shows the annual seasonal pattern for crude oil inventories. This week’s data showed a rise in crude oil stockpiles, which is normal. Inventories are approaching their second seasonal peak. Thus, after next week we would expect a steady slide in oil inventories.
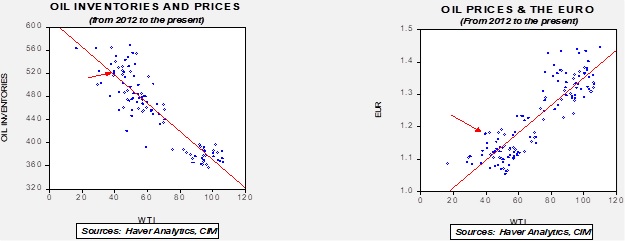
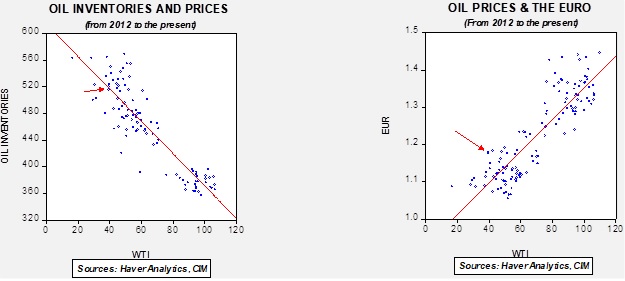
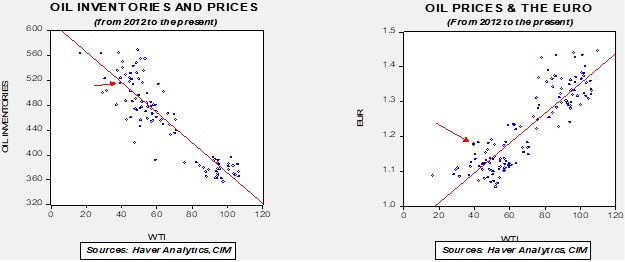
Based on our oil inventory/price model, fair value is $43.67; using the euro/price model, fair value is $62.98. The combined model, a broader analysis of the oil price, generates a fair value of $52.18. The wide divergence continues between the EUR and oil inventory models. However, current oil prices are below all three measures of fair value, suggesting that oil prices are likely undervalued.
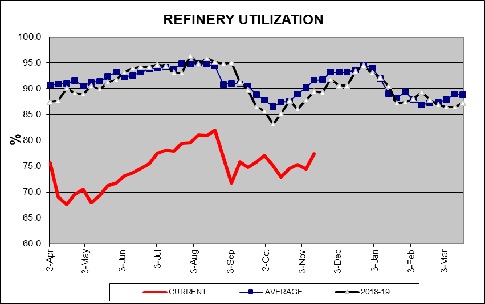
Refinery operations did bounce back this week, rising 2.9%, well better than the 0.6% rise expected. We are in a period of the year when refinery operations are usually increasing, so we will see if this week’s increase has any follow through. If it does, it is supportive for oil prices.
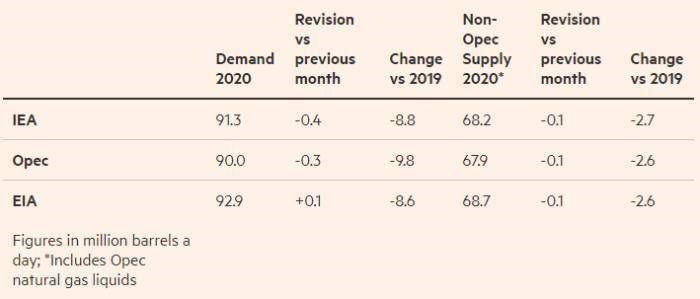
In oil market news, there is hope that OPEC+ will do something to lift prices; technical meetings were held this week in anticipation of the ministerial meeting at the end of the month. Little emerged from the meetings, but that isn’t a surprise. We doubt the cartel will do much at the end of the month other than extend current production levels.
Oil companies are starting to face state-level lawsuits against them for climate mitigation. The industry is moving to push these suits into federal courts to manage them more easily.
Our working assumption is that Joe Biden will be the next president, but until the Electoral College meets next month the election isn’t over. And, until January 20, President Trump is still running the U.S. government. There is a lot of activity that will likely make it difficult for a new president to unwind. First, we are seeing the Department of the Interior call for nominations for drilling in ANWR for lease sales next month. Although this will be a hot button issue that will get much media play, we don’t expect aggressive bidding. Most oil companies are trying to “green” themselves and drilling in ANWR won’t help in those efforts.
In addition to Alaska, the Middle East is also a sensitive area. There were three items of interest. First, although President Trump has shown restraint in directly attacking Iran, apparently he investigated launching air strikes on Iran’s nuclear program. Iran has been boosting its enriched stockpiles since the U.S. broke away from the Obama-era nuclear deal. Second, Al Qaeda’s second-in-command, Abu Muhammad al-Masri, was apparently assassinated in Iran. There are reports that Israel was responsible, but these have not been confirmed. He died in early August. There are rumors, also unconfirmed, that Ayman al-Zawahiri, the head of Al Qaeda, is also dead. It is not obvious why such a senior leader of Al Qaeda was in Iran, but it looks like Tehran wanted to suppress the news. Third, Saudi Aramco (2222, SAR, 35.50) has decided to tap the bond markets to ensure it can pay its dividend. The fact that the company is willing to borrow to pay the dividend suggests it is committed to being a steady source of income to its shareholders.
On a related note, Saudi Arabia reiterated that it reserves the right to acquire nuclear weapons. This statement is likely a signal to an incoming Biden administration that if Iran cannot be prevented from getting a nuclear weapon, then an arms race in the region is likely.
For the first time since the Gulf War, the border crossing at Arar, on the Iraq/Saudi frontier, has reopened. The reopening is a potential signal of a decline in Iran’s influence on Baghdad.
On the unconventional energy front, U.K. researchers are working on a technology to turn plastic waste into hydrogen. Here is a primer on hydrogen as a fuel. The state of Arizona is moving forward on carbon-free energy rules but has rejected a specific role for renewables, which means that hydroelectric and nuclear are the most likely remaining options.