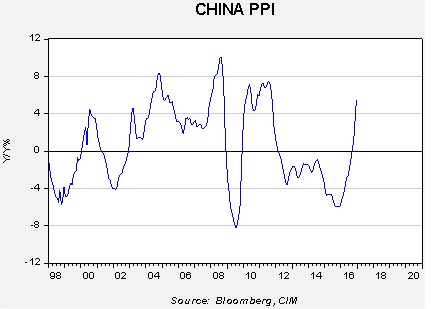
[Posted: 9:30 AM EST] China reported its producer prices (see below). China’s PPI has been rising, suggesting growing inflation pressures in the country.
Over the past year, producer prices have been rising rapidly in China after more than two years of producer price deflation. The combination of monetary stimulus, a weaker currency and a policy to reduce excess capacity does seem to be working to raise price levels.
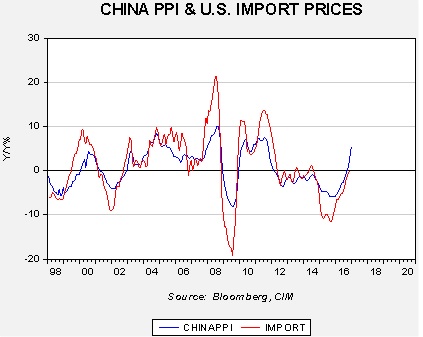
The rise in China’s producer prices will export inflation to the rest of the world, although the weaker CNY will offset some of that price pressure. Still, there is evidence to suggest that rising price pressures in China could find their way to the U.S.
This chart shows the relationship between China’s PPI and U.S. import prices on a yearly change basis. The two series are closely correlated, with r=89.0%. Since 1998, import prices have averaged +1.3% per year. Of course, import prices are also quite sensitive to the dollar. Using the JPM dollar index, when the dollar index is above 110, the average growth is only 0.3%; when the index is less than 110, the average rises to 2.3%. The current JPM dollar index is 118.6, suggesting that the dollar will tend to inoculate the U.S. from most of the impact of rising Chinese inflation. However, the rest of the world won’t be able to as easily rely on this protection; thus, rising Chinese PPI will likely lead to rising global prices. This factor could push emerging economies into a difficult position. Rising prices should lead to tighter monetary policy in the emerging world but the stronger dollar will tend to raise financial stress in the emerging world, which would call for easier policy. China’s PPI could become an issue for the rest of the world.
(Due to Martin Luther King Jr. Day, Part II of this report will be published on January 23.)
One of the key elements of global hegemony is the ability of a nation to project power. Ideally, this means a potential hegemon needs local security. In other words, a nation that faces significant proximate threats will struggle to project power globally. As a general rule, it’s easier to attack via land compared to the sea.
Rome’s power base was the Italian peninsula. It only needed to defend the northern part of the land mass. Spain had a similar situation. The Netherlands was the global hegemon for a while but was always facing a land threat from France. Britain, being an island, was geographically ideal for superpower status; the last successful invasion of the British Isles was in 1066. Finally, the U.S. has managed to create an island effect on a larger land mass giving America more access to natural resources compared to Britain, making the U.S. a nearly ideal hegemon.
In Part I of this report, we will examine American hegemony from a foreign nation’s perspective. In other words, if a nation wanted to attack the U.S. to either replace the U.S. as global superpower or to create conditions that would allow it to act freely to establish regional hegemony, how would this be accomplished? This analysis will begin by examining America’s geopolitical position. As part of this week’s report, we will examine the likelihood of a nuclear attack and a terrorist strike against the U.S. In Part II, we will examine the remaining two methods, cyberwarfare and disinformation, discussing their likelihood along with the costs and benefits of these tactics. We will also conclude in Part II with potential market effects.
[Posted: 9:30 AM EST] It was a rather quiet weekend. We are seeing a drop in oil prices this morning attributed to reports that production in Northern Iraq, which is under Kurdish control, may be rising. It was never certain whether the Kurds would cooperate and the worry is that if one major producing nation cheats then the rest of the cartel may also defect from the agreement.
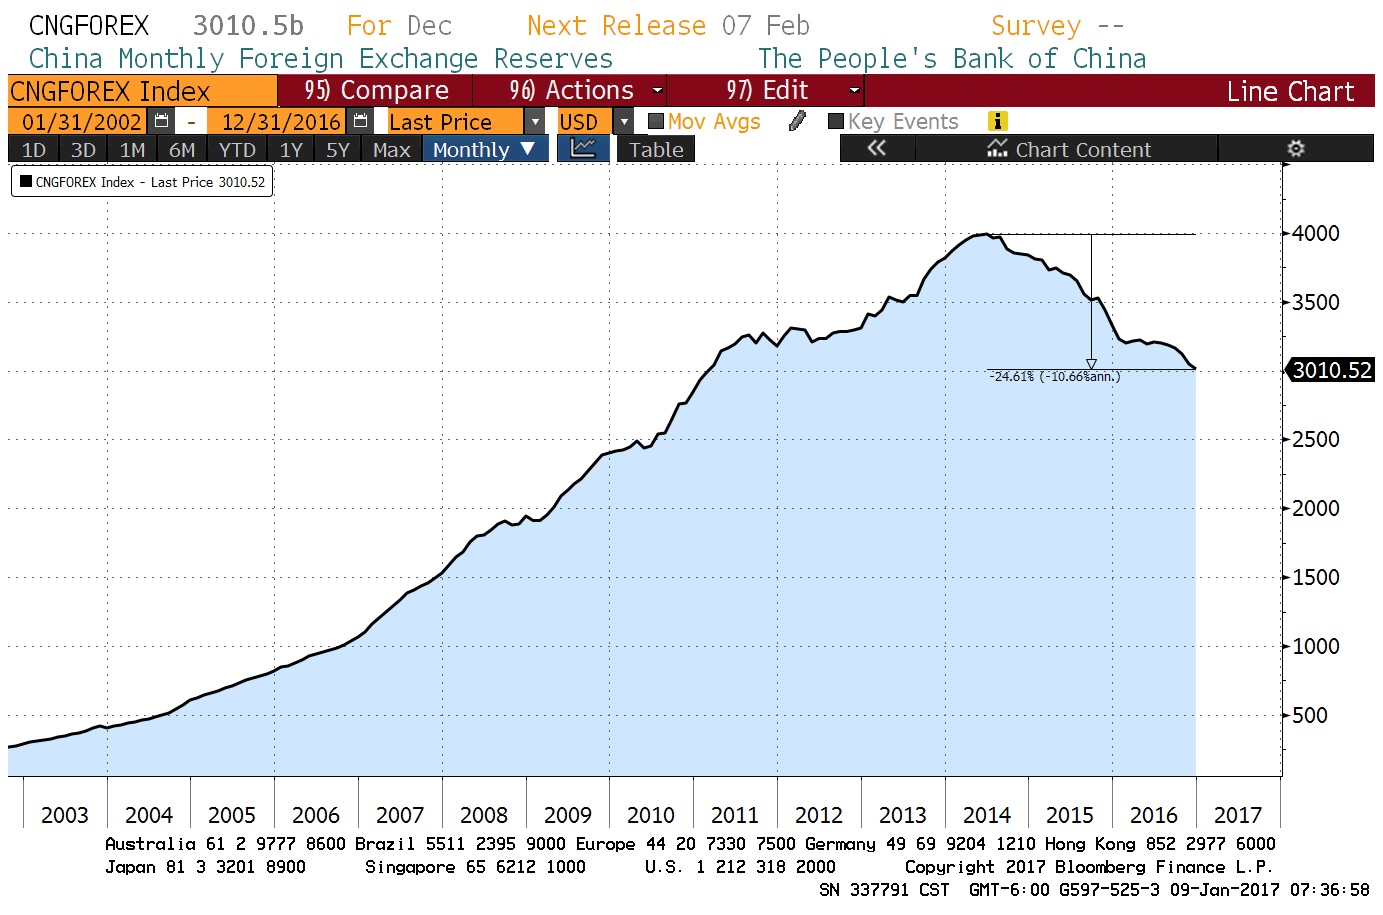
On Saturday, China released its foreign reserves data. Reserves dropped by $41 bn, near forecast.
(Source: Bloomberg)
Since peaking in June 2014, China’s foreign reserves have declined by nearly 25%, or about 10.7% annually. Although the level of reserves is still high, the drop since the peak is approaching $1.0 trillion, a massive amount. There are reports that the PBOC has been meeting with bitcoin firms in China; currently, the discussions appear to be about curbing advertising. If this is the case, it would suggest that Chinese officials, at least for now, will tolerate “insider” use of bitcoin but are interested in discouraging it from becoming a mass product. We suspect that officials realize that shutting down bitcoin would be difficult because it is most likely being utilized by CPC members for capital flight. Thus, controlling it and keeping it from the commoners makes sense.
In other news, PM May’s comments about restricting immigration sent the GBP lower this morning. Although the pound remains at historically cheap levels, worries about a “hard Brexit” continue to weigh on the currency. Reuters is reporting that leftist parties in Germany, namely, the Social Democrats (SDP), the hard-left Die Linke and the Greens, are considering a coalition. This party mix actually now controls more seats in the Bundestag and could rule. However, the SDP, which is center-left, does not agree with the pacifist Die Linke, which wants to pull out of NATO. We suspect the SDP will remain in a grand coalition with Chancellor Merkel’s CDU-CSU but is using this threat to gain more influence in the autumn elections. This suggests to us that Merkel will retain power but be a weaker leader. Finally, Ayatollah Ali Akbar Hashemi Rafsanjani died over the weekend. Rafsanjani was an influential Iranian political figure who held numerous positions since the revolution, including president. He was powerful enough to act as a counterweight to the conservative mullahs; his passing creates something of a power vacuum that will likely be filled by the conservatives.
Over the holiday, I had the pleasure of reading Sebastian Mallaby’s recent biography of Alan Greenspan.[1] The book was thoroughly researched and well-written, and I recommend it to our readers, albeit with fair warning—it’s long and the endnotes are critical to fully understanding the points of the work.
Here are the key points of the book.
All presidential administrations want easy money: Truman implored William Martin to accommodate the Korean War spending, intimating that not doing so was supporting communism. Nixon leaked a rumor (perhaps an early form of “false news”) that his Fed Chair, Arthur Burns, wanted a pay raise. The report infuriated Congress and put Burns on the defensive. Nixon let Burns know that he would set the record straight in return for easy money.[2] Nixon got his wish. Ford wanted accommodative policy. Reagan consistently complained about Volcker’s tight policy and believed a return to the gold standard would be a painless way to weaken inflation expectations.[3] George H.W. Bush felt Greenspan’s tight money cost him the election.[4] Bill Clinton generally avoided publicly criticizing the Fed but was worried that high bond yields would kill the economy.[5] The goal of any president is to stay in power; having the unfortunate circumstance of a recession occurring into an election year is a career-ending event. Thus, wanting the central bank to support the economy into the election is a desire of all presidents.
Financial crises are inevitable—so are government bailouts: Greenspan was a devotee of Ayn Rand and a member of her “Collective.” He opposed government support for bad behavior. However, his youthful position changed as he entered government. The political and economic fallout of letting large and connected financial firms fail was simply too costly. Although the heavily regulated and geographically dispersed financial system avoided crises from 1945 to the early 1970s, it was also an era of higher rates and a less efficient financial system. For example, the ratio of prime lending rates to fed funds in the 1950s to the late 1960s was 1.57x; that fell to 1.18x from the 1970s to the late 1980s. However, improved financial market efficiency came at the cost of financial system problems. What the book makes clear is that regulators won’t prevent crises and no regulator has determined a level of capital that will, either. The only way to reduce the frequency of financial crises and bailouts is through policies that make the financial system less efficient. During good times, the majority of people want the financial system to accommodate their borrowing desires. Thus, they support imprudent lending that inevitably leads to financial crises. Pressing policies that impede lending are unpopular and are only considered in the aftermath of financial events. Over time, these measures will be diluted and repealed. Greenspan supported the repeal of Glass-Steagall and opposed the CFTC’s attempt to gain regulatory control over the swaps market. Although these measures might have reduced the magnitude of the 2008 Financial Crisis, the bipartisan support for Fannie Mae and Freddie Mac (both bodies opposed by Greenspan) made the mortgage crisis unavoidable. Greenspan believed that it was better to allow the bubble to inflate and clean up the “debris” in its wake. That isn’t an optimum policy but probably the only one that is politically feasible.[6]
Inflation targeting leads to asset inflation: As early as 1993, Lawrence Lindsey, a Fed governor, pointed out to the FOMC that focusing solely on inflation control has the potential side effect of creating asset bubbles.[7] Lindsey observed that inflation was falling due to globalization (and not due to Fed policy). We would add deregulation as well. If inflation is low, the central bank could be lured into keeping policy accommodative, potentially leading to asset bubbles in equities, housing and fixed income. Greenspan mostly ignored Lindsey’s concerns; Mallaby speculates that the Fed Chair realized that keeping goods prices in check was politically acceptable but restricting wealth would not be tolerated. Essentially, if some future Fed chair wants to tighten policy ostensibly to deflate an asset bubble, he will have to come up with an inflation narrative to do so. Consequently, monetary policy in an era of globalization and deregulation will tend to support asset prices and increase the odds of asset bubbles.
What do these insights tell us? In a world that is globalized and deregulated, financial markets will have a bullish bias because monetary policy will be persistently accommodative. If President-elect Trump signals an end to globalization and perhaps the unencumbered introduction of new technology, inflation targeting will become less friendly to financial markets. Still, there is no evidence to suggest that the Fed will no longer face pressure from the White House for easy money, not rescue financial markets from volatility or ever target asset prices in setting policy (at least consistently and overtly).
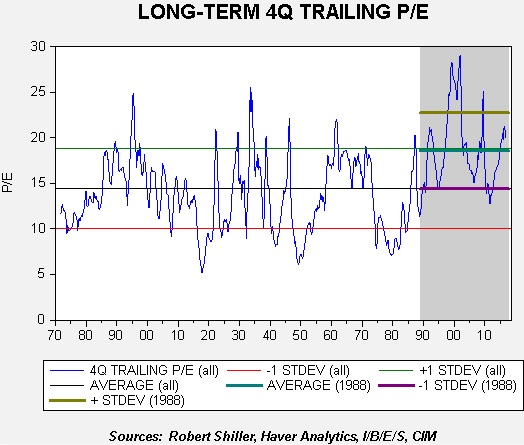
Our conclusions from Mallaby’s work tend to confirm prior comments we have made about S&P 500 P/Es. This chart shows the trailing P/E for the S&P 500; for the current quarter, we use a mix of three quarters (Q1, Q2, Q3) and consensus forecasts for Q4. The area in gray, which encompasses the period from 1988 to the present, has seen an upward shift in the P/E. Essentially, the lows recorded in this period are closer to the average observed over the entire time frame. Investors appear to have shifted their risk tolerance and are willing to “pay up” for earnings. Part of the reason why this shift occurred could be contained in the above analysis of monetary policy. The combination of expectations of central bank “rescues” from market turbulence and policy accommodation stemming from inflation targeting in a globalized economic environment may have given investors more “courage” about accepting a higher earnings multiple than seen in the past. Thus, the current P/E, though historically elevated, may not be all that risky…as long as the monetary policy environment doesn’t change.
[1] Mallaby, S. (2016). The Man Who Knew: The Life and Times of Alan Greenspan. New York, NY: Penguin Press.
[2] Ibid. Greenspan disputed Mallaby’s claim that the former was responsible for letting Burns know how he could get the rumor squelched, pp. 141-144. Mallaby stands by his position.
[Posted: 9:30 AM EST] Happy employment data day! We have the details below but, in general, the data was mostly in line with expectations. We did see a bit of wage growth which has been bearish for bonds but supportive for the dollar.
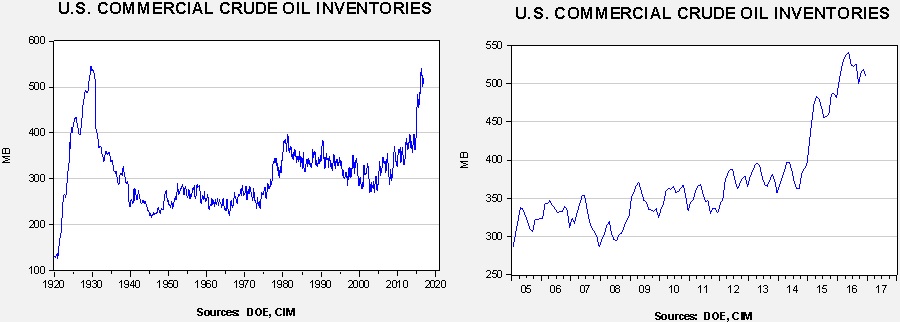
U.S. crude oil inventories fell 7.1 mb compared to market expectations of a 2.0 mb draw. The large drop is mostly due to seasonal factors. At year’s end, firms have an incentive to lower stockpiles for tax reasons. We do note that product inventories jumped last week.
This chart shows current crude oil inventories, both over the long term and the last decade. We have added the estimated level of lease stocks to maintain the consistency of the data. As the chart below shows, inventories remain elevated.
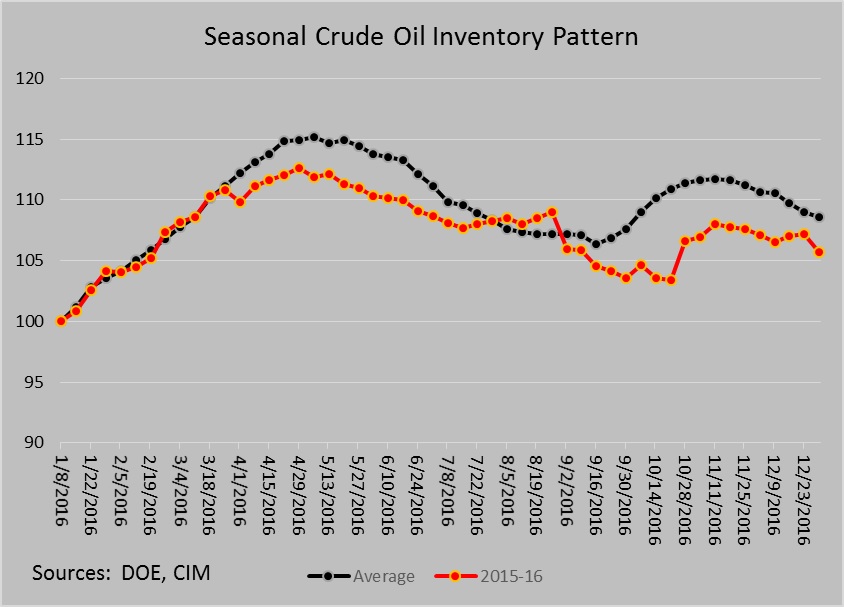
The annual seasonal pattern shows that inventories fell more than the seasonal pattern suggested they should. It is important to note that we are heading into an inventory accumulation period that will last into April. If OPEC is having success in reducing supply, we should see a slower than normal rise in inventories this year.
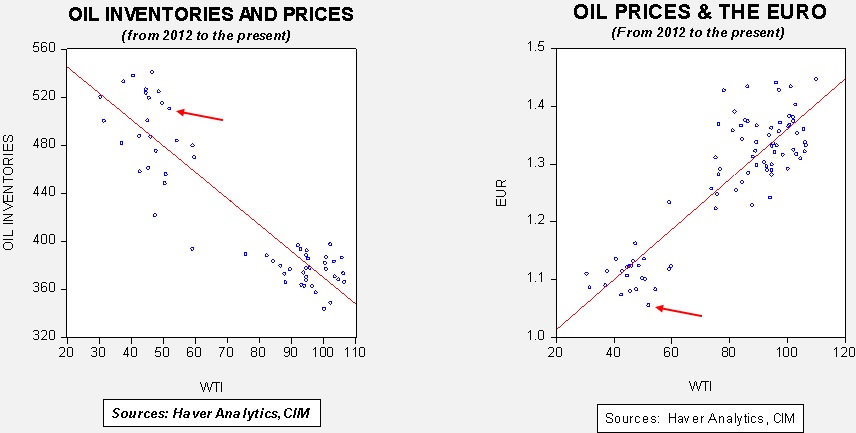
Based on inventories alone, oil prices are overvalued with the fair value price of $42.77. Meanwhile, the EUR/WTI model generates a fair value of $35.32. Together (which is a more sound methodology), fair value is $35.86, meaning that current prices are well above fair value. OPEC has managed to lift prices but maintaining these levels will be a challenge given the dollar’s strength and the continued elevated levels of inventories.
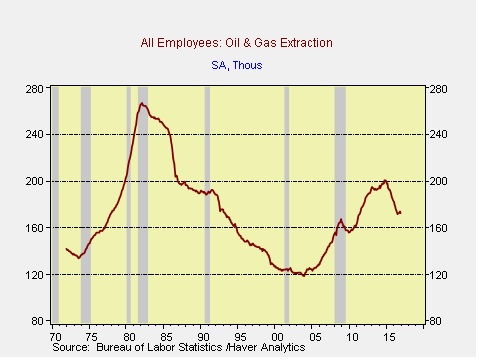
On a related note, employment in oil and gas extraction hasn’t started to lift yet.
However, we have seen stable levels of employment in oil and gas extraction since mid-2016.
The November elections have had a significant impact on the financial markets. It is important to watch how policies from the new administration unfold.
We don’t expect new policies to rapidly accelerate economic growth. However, we do expect growth to improve modestly in 2017.
Our equity allocations are entirely domestic. We shift allocations toward large caps for conservative investors, while focusing more on small and mid-caps for aggressive investors.
We shorten the average maturity of bond allocations, recognizing tighter Fed policy and the potential for higher inflation.
Our growth/value style bias shifts in favor of value at 30/70.
ECONOMIC VIEWPOINTS
Since November, the outcome of the elections has dominated the market narrative. Equity markets rallied sharply, while bonds declined, reflecting a shift in expectations for higher economic and earnings growth, along with rising inflation and tighter Fed policy. Seemingly, the new expectations reflect a lot of optimism for the new president. The thing is, the elephant in the room isn’t really an elephant…at least not a traditional one. Trump made his way into the White House campaigning on positions contrary to several long-standing Republican policies. So, as we begin life under this new administration, we’ll be keeping a close eye on its policies. We’ll be watching to see if Trump tacks toward Republican supply-side views, or if he instead hews to populist priorities.
A supply-side approach would focus on making capital more available and more easily invested. Policies would include lower taxes and less regulation, with the belief that rising capital efficiency would stimulate the economy. Theoretically, companies would hire more workers and increase long-term investments. Some of Trump’s cabinet selections indicate this may be the direction he is headed toward.
On the other hand, Trump’s vocal opposition to the current state of global trade hearkens to a populist view, one contrary to decades of establishment policy. Here the expectation is for “level” global trade agreements to bring jobs back to the United States and increase wages, which would stimulate economic growth. Early jawboning indicates this may be the new policy direction.
Of course, it’s possible we see a combination of supply-side and populist policies. Unfortunately, we don’t expect either strategy to create significant job or wage growth. Technology and innovation appear to be at the root of limited labor opportunities, and both will probably play a role in disappointing some optimists. But even as we don’t expect a big uplift in growth, we do believe there’s room for some improvement in 2017. The economy has maintained a fairly steady, albeit below-average, growth rate, even as the Fed has moved through two rate increases. We believe this trend should continue with modest acceleration, unless the Fed becomes too aggressive.
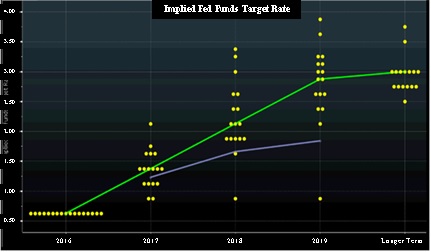
What do we expect from the Fed? Right now, Fed guidance indicates three rate hikes in 2017. Up until recently, the financial markets have been at odds with the Fed’s guidance, having expected a more moderate pace of tightening. For the most part, markets have been correct. But as we look forward, market expectations are now quite closely aligned with the Fed’s guidance. In this chart, the green line represents the median forecast for short-term rates by the Fed’s voting policy members for the next few years, while the blue line illustrates the market’s expectations. We can see the market has generally accepted the Fed’s guidance.
(Source: Bloomberg, CIM)
Will three rate hikes be too much for the economy in 2017? At this point, we don’t think so. However, even the Fed has communicated the importance of evaluating developing economic conditions as it directs monetary policy. We are optimistic the Fed can make the appropriate adjustments, even as we’re aware of the Fed’s proclivity to overtighten. Given the importance of the Fed’s policy decisions, the real elephant in the room may actually turn out to be the Fed.
STOCK MARKET OUTLOOK
Equities performed well in 2016, although most of the returns were earned after the November elections. The surge reflects widespread optimism for higher economic growth and rising corporate earnings. Although we see a pathway for both, we expect equity investors are likely to encounter periods of disappointment along the way. Valuations have risen ahead of actual results, meaning delays and shortfalls could increase downside risk.
Still, we expect a generally good environment for stocks. Small and mid-cap stocks performed particularly well in 2016, and all of the portfolios benefited from their inclusion. We continue to hold a favorable view toward small and mid-sized companies, which may benefit as Washington policies become more inwardly focused on the U.S. economy. However, with the recent strong performance of small and mid-caps, we are shifting some equity allocations toward large caps for conservative and income-oriented investors, and toward mid-caps in our more aggressive portfolios. Large caps tend to have lower relative volatility and we expect this asset class to also perform reasonably well.
Within large caps we favor the energy, financial, industrial and utility sectors, while we are underweight technology and telecom. Sector preferences incorporate our views toward valuations, industry fundamentals and potential changes in regulations. Our growth/value style bias shifts in favor of value at 30/70.
We continue to avoid foreign developed equities. Their valuations may be attractive, and many foreign economies should benefit from a stronger U.S. dollar; however, the strong dollar may also diminish returns on foreign investments for U.S. investors. Risk in emerging markets could also increase. For these reasons, we eliminate our emerging allocations this quarter and have no foreign equity allocations in the portfolios.
BOND MARKET OUTLOOK
Optimism in the equity markets following the elections was mirrored with pessimism in the debt markets. Expectations for higher economic growth benefited equities but also created expectations for tighter monetary policy, which helped move bonds lower. Adding to negative sentiment has been the prospect for rising longer term inflation, which could emerge if global trade declines.
For quite some time, we have included long maturity bonds in portfolios. This allocation not only contributed to income and returns, but it also provided significant diversification benefits. But as we look forward, we may be at the point where a multi-decade decline in rates may be turning around. If we are in a reversal, we don’t expect a rapid increase. Still, we believe it’s prudent to pare back some of the long-term bond allocation this quarter. We continue to favor corporate bonds, including both investment and speculative grades, as we expect relatively low default rates.
OTHER MARKETS
Even with an increase in longer term rates, we believe real estate can continue to perform well. Financing costs remain relatively low, while occupancy and rental rates are constructive. In addition, real estate rental rates often scale with inflation, providing a mechanism to help maintain income should inflation arise. With the modest pullback in the second half of 2016, we believe real estate is attractive, particularly where income is an objective.
Commodity prices could rise with faster U.S. growth, and this asset class may be helpful if we experience rising inflation. However at this point in the cycle, we believe other asset classes offer a more attractive return/risk profile. This quarter we exit the gold allocation, which was useful in addressing global central bank policies; however, our expectation for a strengthening U.S. dollar now makes gold relatively less attractive.
[Posted: 9:30 AM EST] Initial comments from the Fed minutes yesterday suggested they were somewhat hawkish. Market action this morning, especially the dollar’s retreat, has led commentators to suggest that the minutes were, in fact, dovish. We suspect they were neither. The FOMC is in the same situation as all of us—there is a good bit of uncertainty surrounding future fiscal and regulatory policy and until legislation emerges, there is little point in doing too much. We did note that Chair Yellen’s recent trial balloon of allowing the economy to “run hot” by allowing the unemployment rate to fall below what is considered the “natural rate” was mostly downplayed. Simply put, the FOMC won’t let the unemployment rate approach 4% without considering rate hikes. The minutes also suggested that the FOMC may raise rates at a quicker pace if fiscal stimulus does ramp up the economy. It is worth remembering that Chair Yellen downplayed the need for fiscal stimulus in her last press conference, and so increased government spending will likely be taken as a call for tighter monetary policy.
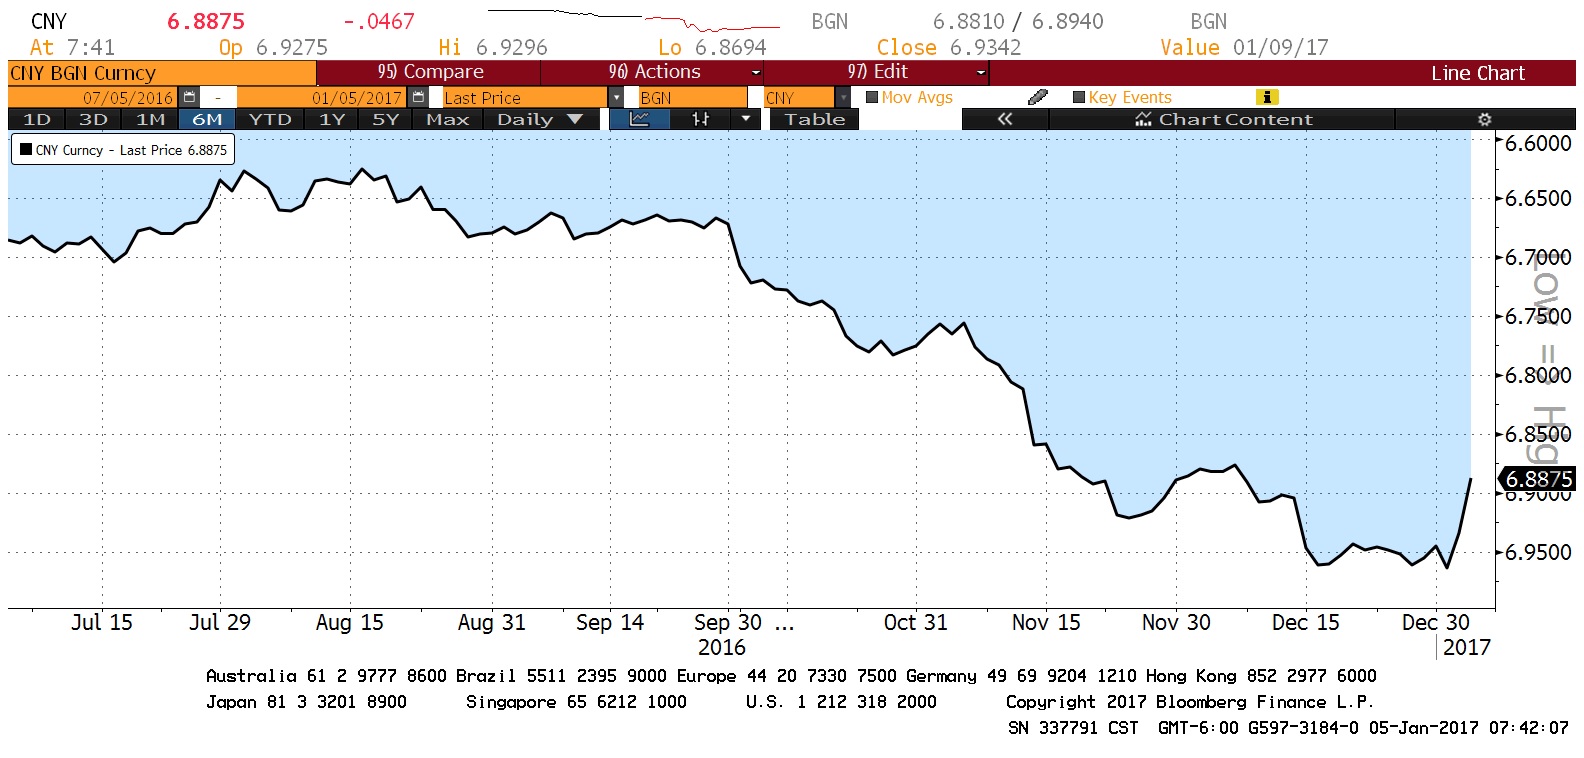
The big news overnight came from China as the CNY staged a strong rally. It has all the elements of a short squeeze as the PBOC and Chinese officials use various methods to cut off avenues of capital flight. In addition, the Xi regime has been instructing companies to repatriate funds from overseas to slow the loss of foreign reserves. These measures apparently caught traders short, leading to what appears to be an aggressive short covering rally.
(Source: Bloomberg)
This chart shows the CNY/USD rate on an inverted scale. Note the strong recovery.
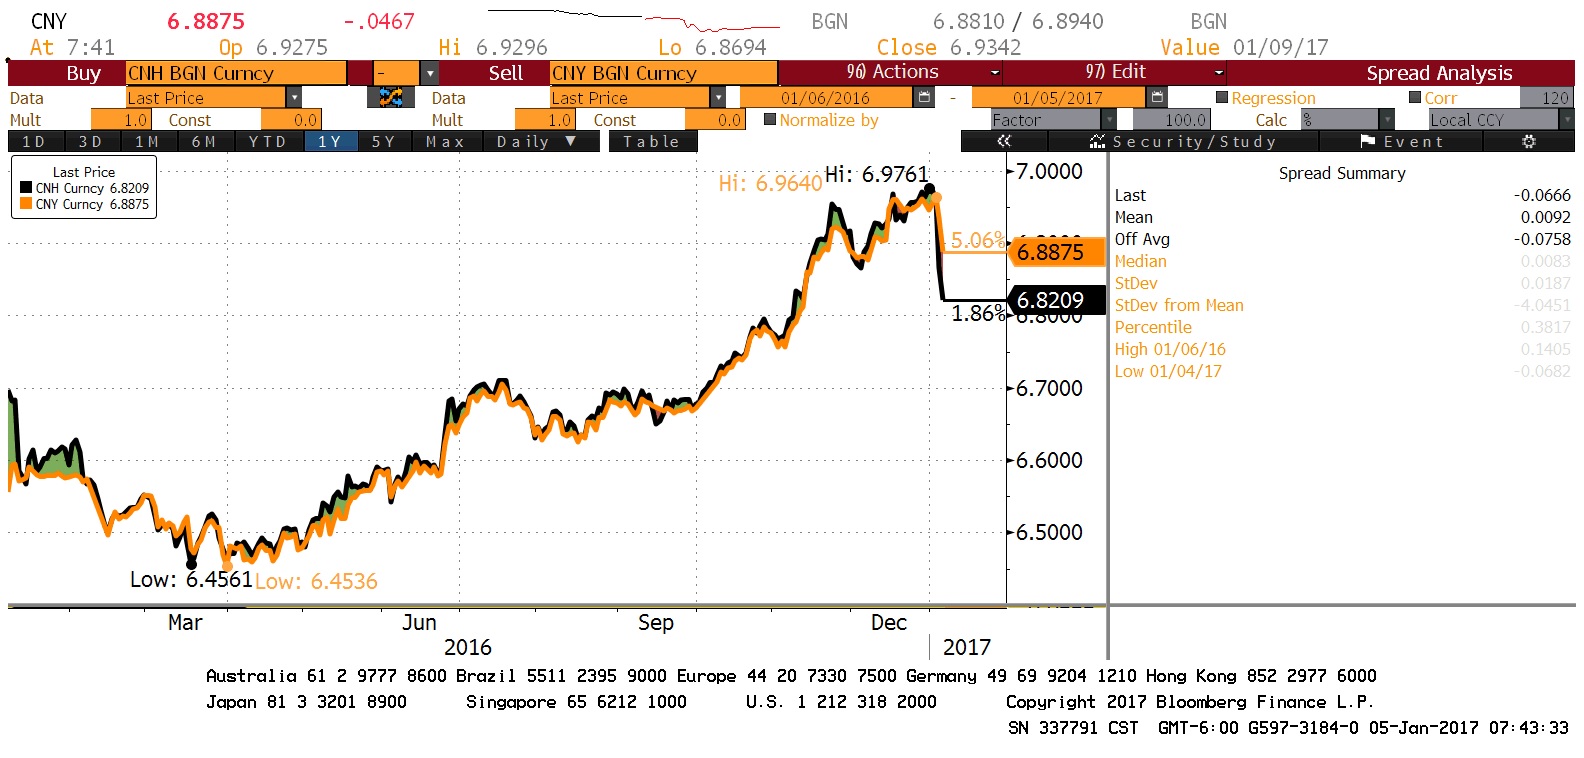
In fact, the recovery has outpaced the offshore yuan.
(Source: Bloomberg)
The offshore rate is shown in yellow and is usually considered the market rate for the currency. The fact that the official rate is strengthening faster than the offshore rate hints at official intervention.
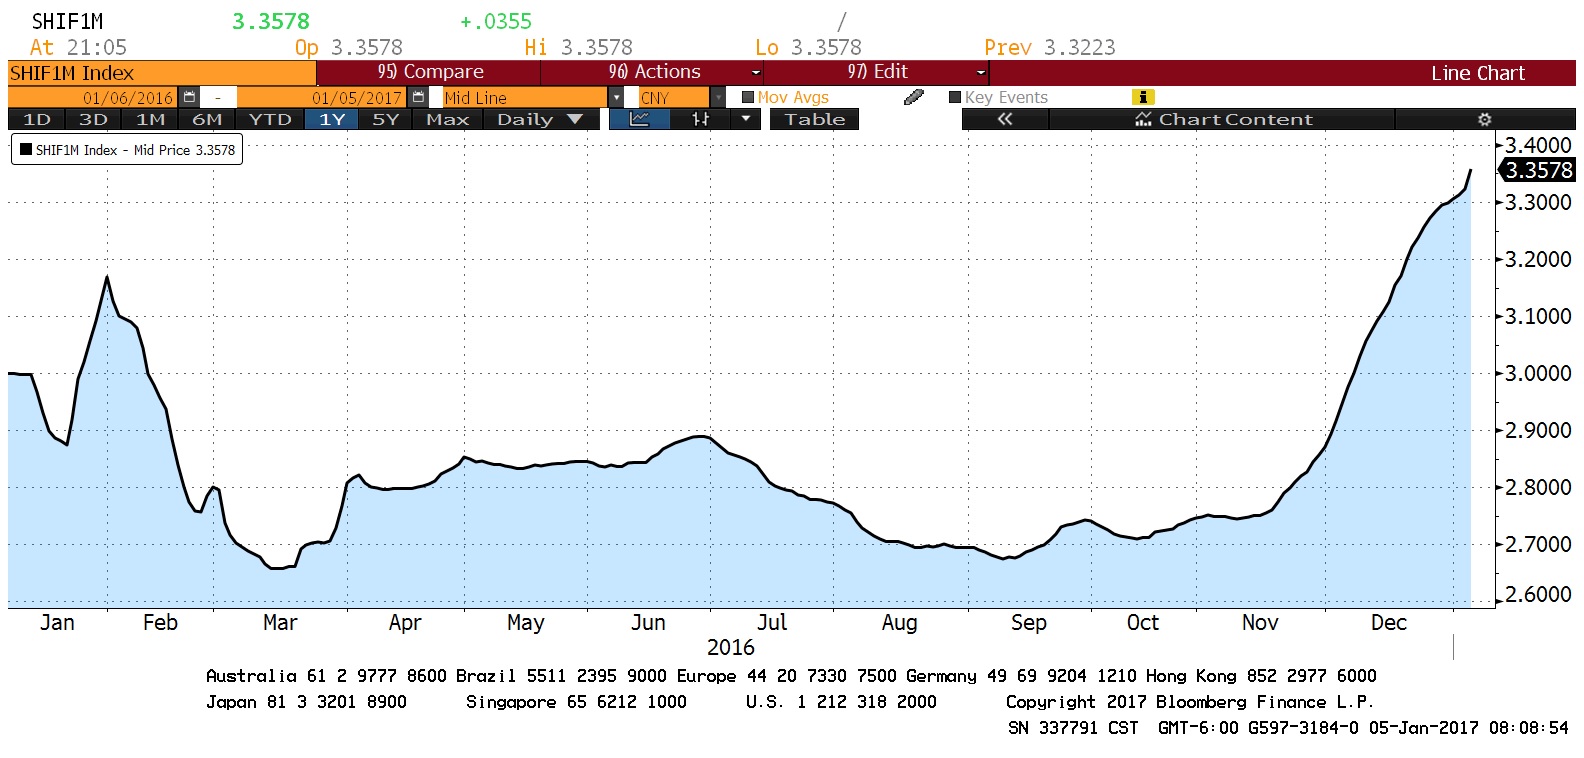
What is China trying to do here? We view this as a successful official intervention. The government wants to undermine the notion that the CNY is a one-way bet and is using means to punish speculators. However, this action does carry a cost in that the PBOC has been forced to steadily raise interest rates.
(Source: Bloomberg)
This chart shows the one-month Chinese LIBOR rate. Since mid-November (about the time of the Trump victory), the PBOC has been guiding rates higher, most likely in a bid to make shorting the CNY more expensive. We doubt China will want to take rates much higher and so we view the strength in the CNY as temporary; we view dollar weakness today in the same light.
Finally, as a side note, bitcoin is down almost 17% today, reflecting the rally in the CNY.
[Posted: 9:30 AM EST] It was mostly quiet overnight. Perhaps the most interesting news came from National Front Leader Marine Le Pen, who indicated that she would want a single currency in Europe to continue even if France leaves the Eurozone. Le Pen has said before that if she wins the presidency she will hold a referendum on exiting the Eurozone and returning to the franc. However, today she seemed to indicate that she really wants a return to the old European Monetary System (EMS), which was a series of exchange rate pegs with some degree of flexibility. We suspect she is trying to soften her currency position in front of the spring elections. Polls suggest most voters in France would prefer to stay in the Eurozone and our research suggests that there is little need for France to leave the single currency. Simply put, in terms of relative inflation, there are no serious valuation problems in France. By harkening back to the pre-Eurozone era, Le Pen is, it seems, looking to “make France great again.” Of course, the EMS also existed when there were two Germanys.
Britain’s ambassador to the EU resigned in frustration with the May government. Sir Ivan Rogers was one of the country’s most experienced diplomats. He has consistently indicated that Brexit would be messy and difficult and that the EU is likely to make the process onerous, simply as a warning to other members that leaving is costly. According to the FT, members of the May administration were tired of Roger’s pessimism; sadly, he is probably giving the prime minister an accurate picture of Britain’s future outside the EU.
According to Bloomberg, Chinese officials are looking at a number of measures to curb capital flight. China allows households to move $50k each year offshore; this year, reports suggest the paperwork has expanded to discourage such actions. As we have documented over the past year, China has been spending part of its foreign exchange reserves to slow the CNY’s weakness. According to reports, China is “encouraging” state owned firms to bring offshore funds back to China and may require them to convert these offshore holds to CNY.
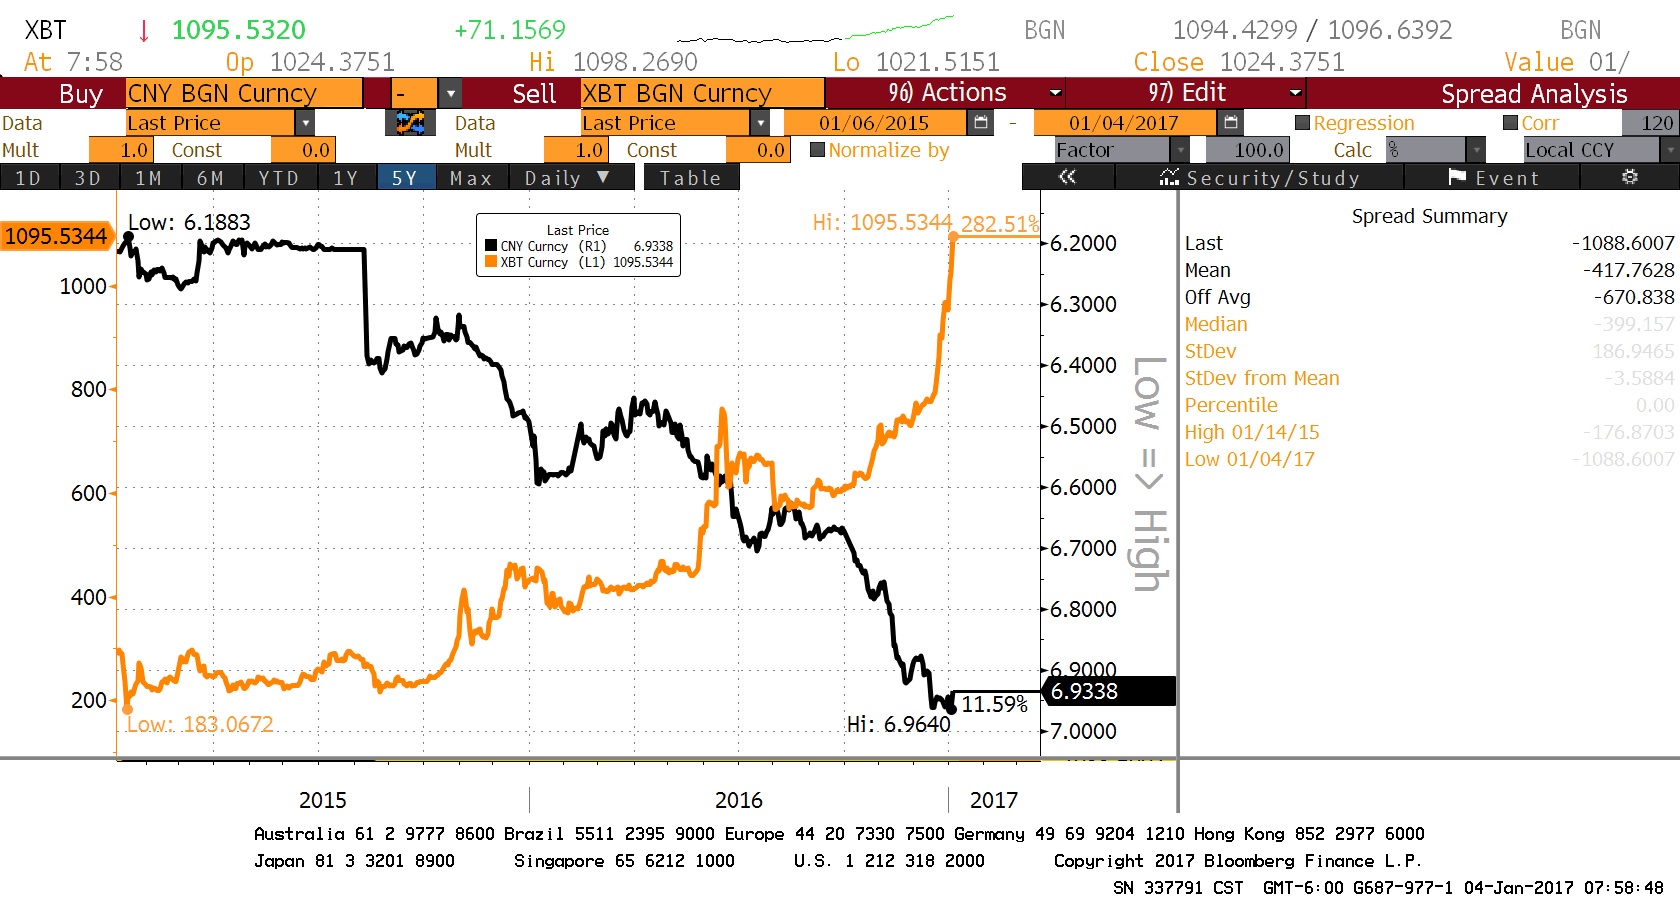
One of the indicators we monitor is bitcoin.
(Source: Bloomberg)
This chart shows the CNY against the XBT/USD relationship over the past two years; we have seen the two exchange rates steadily diverge. This may be due to Chinese investors using the anonymous bitcoin architecture as a conduit to push money out of China. If this is the case, and Chinese authorities can’t find a way to close this portal, bitcoin could continue to rise and China will be forced to use more of its reserves to prevent the CNY from weakening further and faster.
After some profit-taking into year’s end, the first trading day of the year is starting off with a return to mid-December trends—long-term interest rates are rising, the dollar is up and U.S. equities are up as well. The dollar’s strength is pushing gold prices lower but oil continues to trade stronger despite the rising greenback. News that Kuwait and Oman have made production cuts in line with the OPEC agreement is supporting higher oil prices.
President-elect Trump has appointed Robert Lighthizer to the post of U.S. Trade Representative. Like Trump’s pick of Peter Navarro, Lighthizer leans toward trade restrictions, especially against China, and is friendly toward tariffs and quotas.
One of the aspects of Trump’s trade policy that has, in our opinion, been underestimated by financial markets is the lack of understanding of the reserve currency role. The dollar, as the global reserve currency, is used for trade transactions that do not involve the U.S. The BIS estimates that about 80% of trade-related letters of credit are denominated in U.S. dollars.[1] The most effective way for foreign nations to acquire dollars is by trading with the U.S. In fact, the world needs to run trade surpluses with the U.S. so that there are ample dollars available for global trade. This situation creates a problem; eventually, either domestic support for trade falters in the reserve currency nation due to job losses or foreigners lose faith that the reserve currency nation will maintain the value of the currency. This problem was first identified by an economist named Robert Triffin (thus it has been described as the “Triffin dilemma”).
What the incoming administration doesn’t seem to recognize is that if the U.S. takes steps to restrict trade it will reduce the supply of dollars on global markets. Falling supply without a commensurate reduction in demand will lead to a stronger dollar. And, fears among foreign nations that the U.S. is going to restrict trade will actually boost demand, enhancing the effect. Couple this policy with proposed changes in corporate tax law that would create border adjustments to tax imports and not exports and the dollar will rise further (not to mention the potential impact of a repatriation holiday). In the face of tighter imports, the FOMC may be inclined to lift rates sooner and by more than the markets expect. Although we always have concerns about “one-way trades,” a stronger dollar looks inevitable.
Overall, then, what does a stronger dollar bring? It’s bearish for commodities; gold is especially vulnerable. As noted above, oil is trading counter to the stronger dollar on expectations of OPEC supply cuts but, in general, dollar strength is negative for commodities. Dollar strength is a profoundly bearish factor for emerging market equity and debt; dollar strength has been behind emerging market economic problems since currency floating began. For developed markets, it’s something of a wash. The weaker foreign currencies act as a form of policy stimulus, which is bullish for equities in local terms, but the unknown for a U.S.-based investor is whether the dollar strength will offset the equity market rally. In the U.S., small and mid-caps tend to benefit on a relative basis to large caps because the latter have more foreign exposure and thus earnings for large caps are at greater risk.
We use cookies to ensure that we give you the best experience on our website. If you continue to use this site we will assume that you are happy with it.