

Author: Amanda Ahne
Asset Allocation Bi-Weekly – Presidential Cycles and Stock Performance (September 30, 2024)
by the Asset Allocation Committee | PDF
As the November elections approach, there has been significant debate over which presidential candidate — former President Donald Trump or Vice President Kamala Harris — would be better for US equity markets. Both candidates have made bold promises about their plans to boost national prosperity. Trump has vowed to reduce burdensome regulations and deliver tax cuts to households and businesses, while Harris has advocated tax incentives for homebuilders to boost supply, address housing affordability, and help bring down the cost of living.
While both candidates have reasonable policy goals but differing policy prescriptions, their overall impact on investor portfolios may likely be similar. Contrary to popular belief, presidents have had limited influence on equity returns. An analysis of the S&P 500’s performance from 1930 to 2023 shows that stocks have provided a return of about 30%, on average, over a typical four-year term, with the returns under Republican presidents only slightly topping the returns under Democrats.
The key reason for the similar outcome is that presidents are often constrained by the conditions they inherit. These include the state of the economy, the composition of Congress, and monetary policy. While a president may have some influence over these factors, their ability to shape them is largely determined by the circumstances they receive in the election. A popular president may secure a Congress with a substantial majority, enabling them to pass key legislation and select their preferred candidate as the chair of the Federal Reserve. That said, such a strong majority with unified government is not the norm.
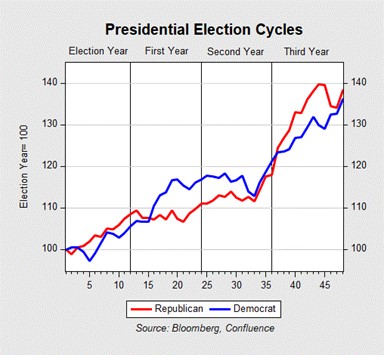
Historically, stock market performance during US presidential election years has been influenced by the broader economic trends in place at the time. While equities under Republican administrations often outperform Democratic administrations in election years, Democrats close the gap over the first and second years following the election. This tendency is largely attributed to the economic conditions that new Democratic presidents frequently inherit. Democrat victories often coincide with economic downturns, allowing for stimulus measures that eventually help asset prices recover. Conversely, Republican administrations tend to benefit from a “continuity rally” following the positive economic performance in the year prior to the election.
During their first year, Democrats tend to get off to a better start but ultimately suffer the same fate of stagnation. New presidents often enjoy greater flexibility to provide more fiscal and monetary stimulus, helping to improve the economy. This can boost market optimism. By their second term, however, leaders typically face diminished support, making it more difficult to pass significant legislation in the first year. This predictability, while not without its challenges, can often be positive for equities.
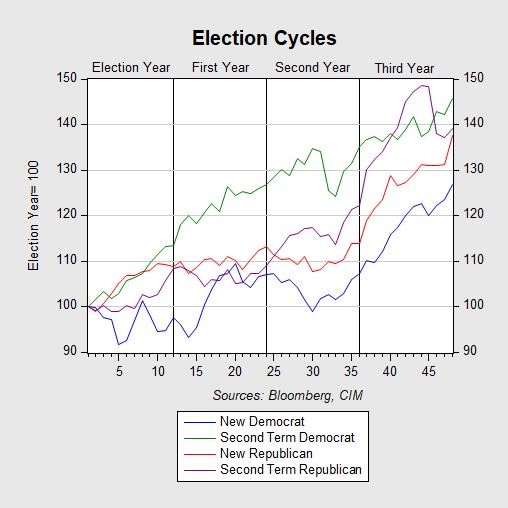
In contrast, new Republican administrations often inherit a tougher policy environment in the first year, marked by higher inflation and tighter monetary policies. Historically, average policy rates have been roughly three times higher under Republicans (7.8%) than under Democrats (2.4%); inflation rates have also been higher (5.1% vs. 3.0%, respectively). With the exception of the Nixon-Ford administration, second-term Republican presidents generally fare better than their first-term counterparts, for similar reasons as second-term Democrats.
In the following year, midterm elections significantly shape market sentiment as Congress goes through a reshuffle. Democrats often get the worst of it and lose an average of 28 House seats and 3 Senate seats, while Republicans typically lose 21 House seats and 1 Senate seat. This shift in Congress leads to concerns about the future of recent policy decisions by Democrats, creating uncertainty as markets gauge the potential impact on future policy. Conversely, Republicans’ relative successes in midterms often signal confidence in the president’s leadership, boosting expectations of policy continuity and benefiting equities.
The third year of a presidential term, leading up to the election, often sees strong economic performance for both parties. This trend can partly be attributed to political gridlock, which limits major legislative changes and creates a stable environment favorable to the stock market. While brief market dips may occur, particularly under Democratic presidents due to budget negotiations that introduce uncertainty, these downturns are typically followed by a rebound, reflecting investors’ confidence in the broader economic trajectory.
In sum, presidents are often labeled as either pro-market or anti-market, but research suggests that their influence on the economy and stock market is often overestimated. A president’s first year is typically focused on addressing ongoing economic challenges. The second year can be more uncertain, as the composition of Congress is solidified. The third year often sees a boost in the market because of investors’ preference for political gridlock. For investors, this election cycle highlights the importance of focusing on broader economic factors, monetary policy, and the composition of Congress. While the presidency can play a role, it’s essential to consider the bigger picture.
Business Cycle Report (September 26, 2024)
by Thomas Wash | PDF
The business cycle has a major impact on financial markets; recessions usually accompany bear markets in equities. The intention of this report is to keep our readers apprised of the potential for recession, updated on a monthly basis. Although it isn’t the final word on our views about recession, it is part of our process in signaling the potential for a downturn.
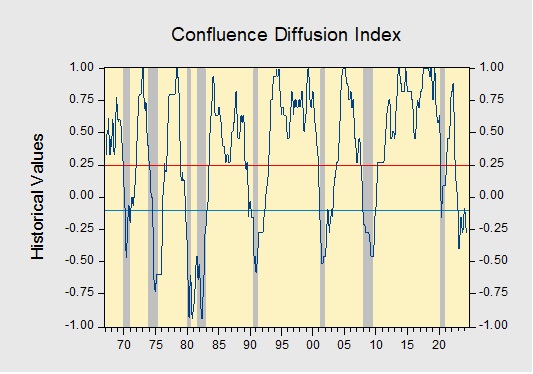
The Confluence Diffusion Index remained in contraction. The August report showed that six out of 11 benchmarks are in contraction territory. Last month, the diffusion index improved slightly from -0.2727 to -0.2152 but is still below the recovery signal of -0.1000.
- Financial conditions eased as investors anticipated a potential shift in Federal Reserve policy.
- The manufacturing sector showed signs of a modest recovery but remained fragile.
- The labor market remained robust despite emerging indications of cooling.
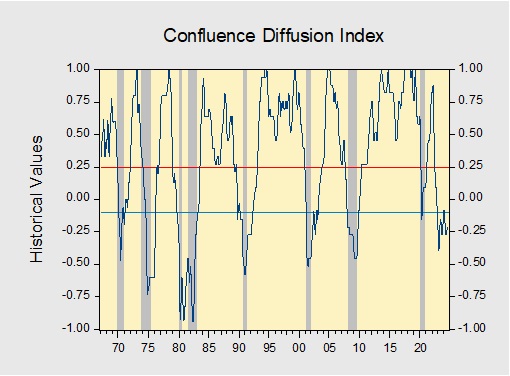
The chart above shows the Confluence Diffusion Index. It uses a three-month moving average of 11 leading indicators to track the state of the business cycle. The red line signals when the business cycle is headed toward a contraction, while the blue line signals when the business cycle is in recovery. The diffusion index currently provides about six months of lead time for a contraction and five months of lead time for recovery. Continue reading for an in-depth understanding of how the indicators are performing. At the end of the report, the Glossary of Charts describes each chart and its measures. In addition, a chart title listed in red indicates that the index is signaling recession.
Bi-Weekly Geopolitical Podcast – #53 “Eight Megatrends Every Investor Should Know” (Posted 9/23/24)
Bi-Weekly Geopolitical Report – Eight Megatrends Every Investor Should Know (September 23, 2024)
by Patrick Fearon-Hernandez, CFA | PDF
One of the defining characteristics of our investment strategy work here at Confluence is that we pay close attention to big, global trends in geopolitics, economics and trade, demographics, technology, and even social and political developments. We then try to determine how to incorporate those trends into our strategies, either by managing the risks they impose or identifying and investing in the associated opportunities. We think this discipline can be fruitful because big, global trends are often long lasting and relatively predictable. Shorter-term, idiosyncratic forces can still make asset prices volatile from time to time, but the impact of “megatrends” often comes back to the fore relatively quickly.
Our regular readers know that we pay especially close attention to geopolitical trends. However, in this report, we want to provide a broader survey of several megatrends that are likely to remain in place for at least the next decade and be especially salient to investors. This list isn’t necessarily comprehensive; another writer could easily come up with an alternative set. All the same, we think it will be interesting for investors to consider the wide range of global trends that could affect their investments.
Don’t miss our accompanying podcasts, available on our website and most podcast platforms: Apple | Spotify
Asset Allocation Bi-Weekly – #125 “The Benjamin Button Dividend” (Posted 9/16/24)
Asset Allocation Bi-Weekly – The Benjamin Button Dividend (September 16, 2024)
by the Asset Allocation Committee | PDF
A company’s journey to industry prominence typically involves several stages: launch, growth, shakeout, maturity, and decline. Historically, large capitalization stocks were often considered to be in the maturity stage of their development. Many investors therefore assumed that these companies had strong enough earnings to initiate or maintain dividend payments, making them seem more attractive than their smaller counterparts that were primarily considered for their capital gains potential. However, recent trends suggest that times have changed.
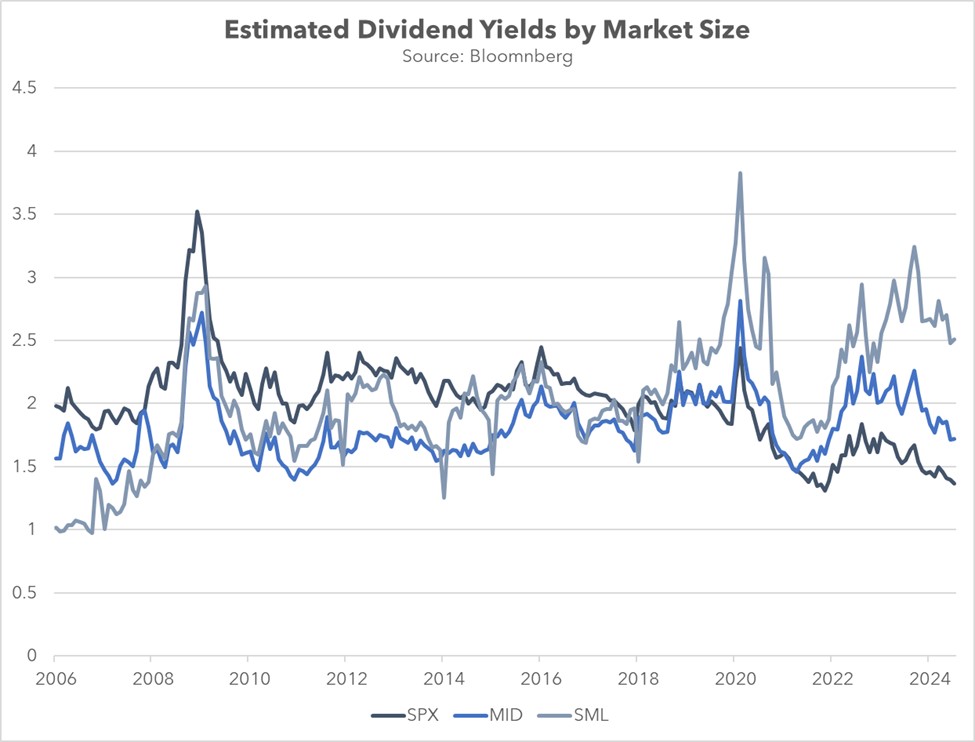
Over the past seven years, small cap stocks have consistently surpassed their mid-cap and large cap counterparts in terms of estimated dividend yields. This gap can be attributed to both relative price appreciation and dividend policy. During this period, the large cap S&P 500 stock price index grew nearly twice as fast as the mid-cap S&P 400 price index and the small cap S&P 600 price index. Additionally, small firms have significantly increased their dividend payout ratios relative to their larger peers, from just under 40% to over 60% in the last decade. In contrast, large cap firms have maintained relatively stable dividend policies over the same period.
The primary shift in the relationship between the small cap and large cap indexes has been driven by a changing sectoral composition, largely due to the survivorship and maturation of technology companies. As smaller tech companies have grown and become more successful, they have been rebalanced into the large cap index or were bought out. Meanwhile, those that failed to move up were removed. This dynamic has led to a significant increase in the weight of the tech sector within the large cap index at the expense of the small cap index.
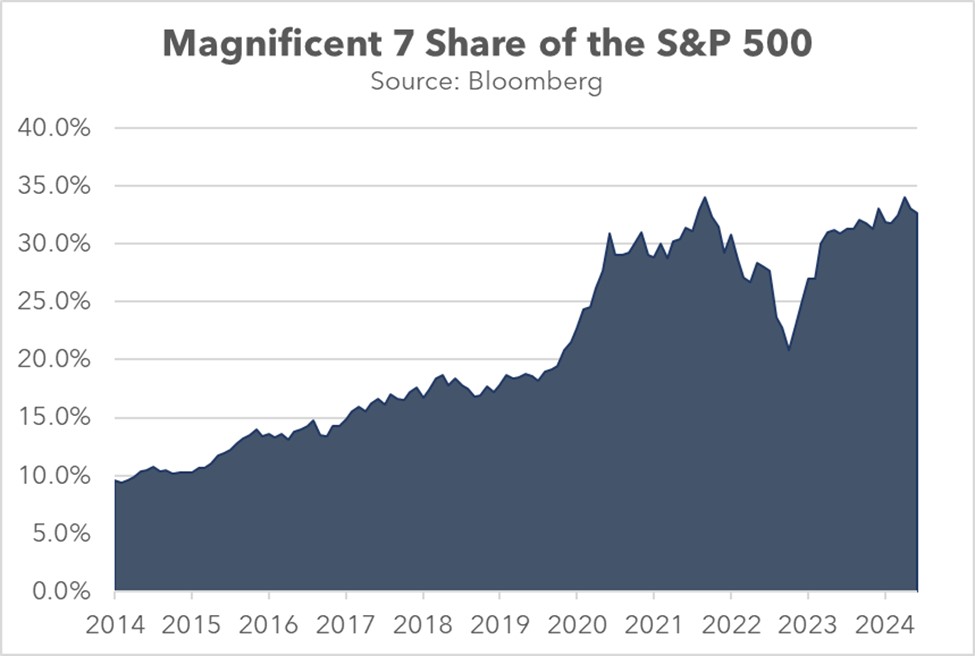
Over the past decade, information technology and communication companies have significantly increased their share of the large cap S&P 500 index, rising from 22.0% to 39.0%. In contrast, the small cap S&P 600’s exposure to tech companies has declined from 20.0% to 16.5%. As a result, the broad large cap index now exhibits more growth-like characteristics than its smaller counterparts. The S&P 500’s price-to-earnings ratio of 25.1 is substantially higher than those of the S&P 400 and S&P 600, which are each around 19.0. Moreover, the large cap index has become increasingly susceptible to price fluctuations in a select group of companies.
While tech companies have lost share within the small cap index, financial services and real estate firms have largely filled the void. Their rise was driven in part by low interest rates, which incentivized investors to seek assets with capital gains potential. This preference led to a surge in demand for large cap tech companies, which were perceived to have strong growth potential, at the expense of financial services and real estate firms, which paid dividends but were seen as less likely to appreciate significantly over time.
The substantial increase in the small cap index’s exposure to the Financials and Real Estate sectors is primarily attributable to reclassifications. Beginning in 2018, larger financial and real estate firms began to decline in market value, leading to their reclassification from the S&P 500 to the S&P 400. This trend intensified following the pandemic as many of these companies experienced further declines and they then made their way into the S&P 600.
These changes have resulted in a relative increase in the number of firms paying out substantial dividends within the small cap index. Over the past six years, the S&P 600’s exposure to financial and real estate companies has increased from 22.1% to 27.6%, while the S&P 500’s share has decreased from 17.6% to 15.7%. The S&P 400 saw a slight decline from 26.1% to 25.0% in its holdings of these sectors. Notably, the small cap index now has as many financial services and real estate firms as the large and mid-cap indexes had combined just 10 years ago.
Contrary to popular belief, a company’s size is not a reliable indicator of maturity. In fact, the average lifespan of S&P 500 companies has dramatically decreased in recent decades. The influx of tech companies into the large cap space has further accelerated this trend. In 1984, the average company survived 36 years, whereas today that figure is barely over 18 years. To put it into perspective, these companies are barely old enough to vote and not yet old enough to drink. This shorter tenure may explain why larger firms often exhibit less mature behavior than some of their smaller, dividend-paying counterparts, which have a weighted average lifespan of at least 32 years. In sum, investors seeking dividend income may now need to focus more on small cap companies than they did in the past.
Confluence of Ideas – #37 “Reviewing the Asset Allocation Rebalance: Q3 2024” (Posted 9/11/24)
Business Cycle Report (August 29, 2024)
by Thomas Wash | PDF
The business cycle has a major impact on financial markets; recessions usually accompany bear markets in equities. The intention of this report is to keep our readers apprised of the potential for recession, updated on a monthly basis. Although it isn’t the final word on our views about recession, it is part of our process in signaling the potential for a downturn.
The Confluence Diffusion Index remained in contraction. The July report showed that seven out of 11 benchmarks are in contraction territory. Last month, the diffusion index fell slightly from -0.2727 to -0.2818, below the recovery signal of -0.1000.
- Fed rate cut speculation helped push down interest rates.
- The goods-producing sector showed slight improvement but remains weak.
- The labor market showed signs of deterioration.
The chart above shows the Confluence Diffusion Index. It uses a three-month moving average of 11 leading indicators to track the state of the business cycle. The red line signals when the business cycle is headed toward a contraction, while the blue line signals when the business cycle is in recovery. The diffusion index currently provides about six months of lead time for a contraction and five months of lead time for recovery. Continue reading for an in-depth understanding of how the indicators are performing. At the end of the report, the Glossary of Charts describes each chart and its measures. In addition, a chart title listed in red indicates that the index is signaling recession.