Tag: rbg
Asset Allocation Weekly (October 2, 2020)
by Asset Allocation Committee | PDF
The death of Ruth Bader Ginsburg was yet another political shock for 2020 in a year rife with unusual events. The year began with the first official case of COVID-19 in Washington State on January 20. The pandemic and subsequent measures to contain the virus have led to unprecedented levels of economic volatility. President Trump was acquitted of impeachment on February 5. Relations with China have deteriorated.
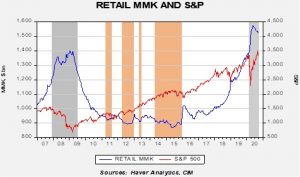
As we head into the election, investors’ fears are high. For example, retail money market funds (RMMK) remain elevated, though off their earlier peaks.
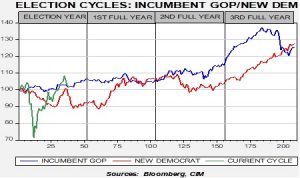
Our political cycle monitor suggests that a Biden win could result in a decline in equities into October.
Barring an unexpected landslide, it is quite possible that this election could be disputed. The last time this occurred, in 2000, the election wasn’t decided until December 12, when the Supreme Court effectively ended the recount. George Bush won a narrow victory in Florida and in the Electoral College (271/266). The financial markets were affected by the outcome; in the period from the election on November 7 until the Supreme Court decision, the S&P 500 range from high (made on November 8) to low (made on December 1) was 9.9%. A decline of this magnitude would probably not be enough to warrant substantial portfolio adjustments.
Voter attitudes were not nearly as hardened then as they are now. A Pew survey suggested that 45% of voters thought that the winner really mattered, while 49% believed “things would remain about the same.” Currently, 83% of voters think it really matters who wins and only 16% believe that “things would remain about the same.” The Pew survey suggests that this election is being viewed as zero-sum; losing is perceived as devastating, so both sides are primed to contest a close election.
Although equity markets have performed quite well from their March lows, the recent weakness does appear to be starting the process of discounting a Biden victory. Although we would not necessarily expect a decline to the 90% level implied on the above chart,[1] a period of weakness in the next few weeks is likely.
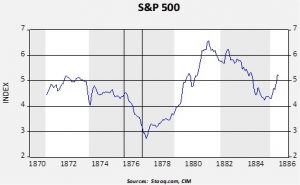
Is there a precedent for the current election? The best analog is the 1876 election, which was won by Rutherford B. Hayes in the electoral college by a single vote, 185-184 over Samuel J. Tilden. And, that result only occurred weeks after the November ballot. Hayes was given the presidency in return for ending Reconstruction. An analysis of this election will be the subject of an upcoming WGR, but the following chart offers some idea of the impact of an uncertain election outcome when it is perceived as zero-sum.
From March 1876 to March 1877 (when Hayes was inaugurated), the index, on a monthly average basis, fell 29.7%. Although the recovery from the lows was robust, the March 1876 level was not exceeded until October 1879. As we will discuss in the upcoming WGR, the 1876 election occurred during the long depression that began with the Panic of 1873, which was considered the worst economic downturn until the Great Depression. Thus, the disputed election cannot be blamed for the entire decline, but it likely contributed. Increased tensions in the November election is a factor the Asset Allocation Committee will grapple with in the upcoming portfolio rebalance.
[1] To quote Ned Davis, a famous market analyst, cycle analysis shown above should be used more for direction and less for level.


