by the Asset Allocation Committee | PDF
While the Federal Reserve’s dual mandate focuses on achieving maximum employment and stable prices, managing long-term interest rates has also played a significant role since the enactment of the Federal Reserve Act in 1977.[1] Recent actions have raised questions about the Fed potentially anchoring the 10-year Treasury yield to remain within a range of 4.0% to 5.0%, primarily using the nontraditional tool of “forward guidance.”
Over the last few months, policymakers have leaned heavily on forward guidance to achieve their policy aims. The strategic communication of future policy intentions allows Fed policymakers to influence market expectations and adjust financial conditions significantly. This, in turn, grants them greater flexibility in adjusting monetary policy and enables them to react more nimbly to economic changes without solely relying on interest rates or balance sheet adjustments.
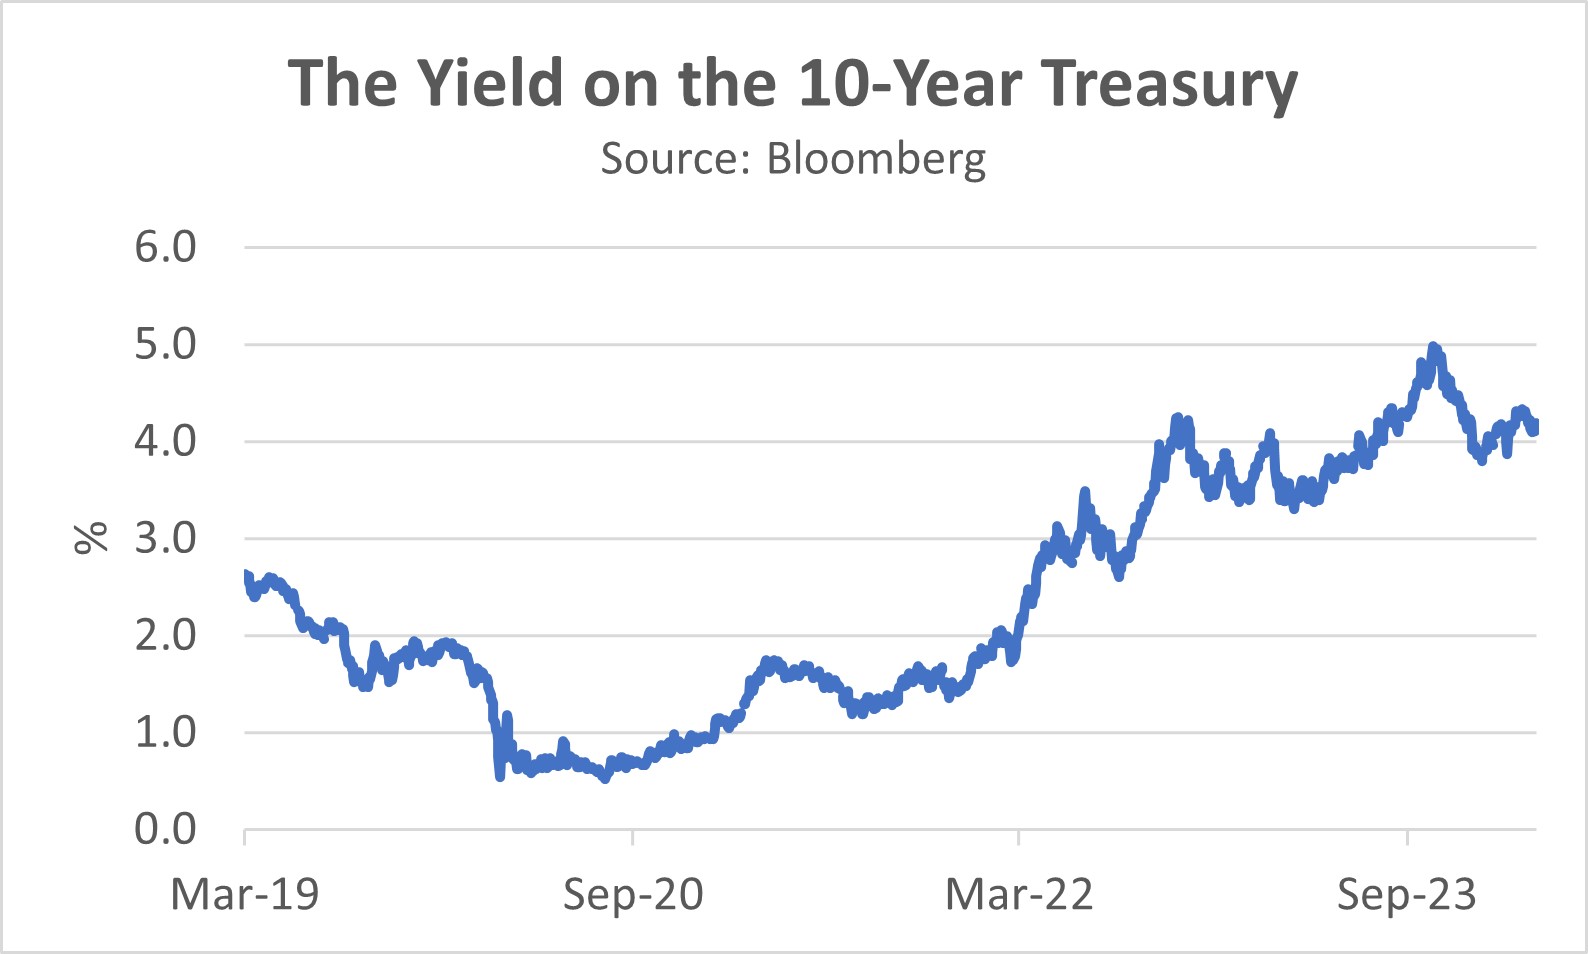
This tool became particularly noticeable in October 2023, when yields on 10-year Treasury bonds surged above 5% for the first time in over 16 years. Several factors contributed to this surge. For instance, heightened government issuance of US Treasury obligations coupled with a surprisingly resilient economy prompted investors to reassess whether the low interest rates adequately compensated for the risks associated with holding long-term debt. Moreover, the Fed’s September Summary of Economic Projections hinted at an additional rate hike before year-end, fueling concerns that forthcoming short-term rate increases might outpace long-term yields even further.
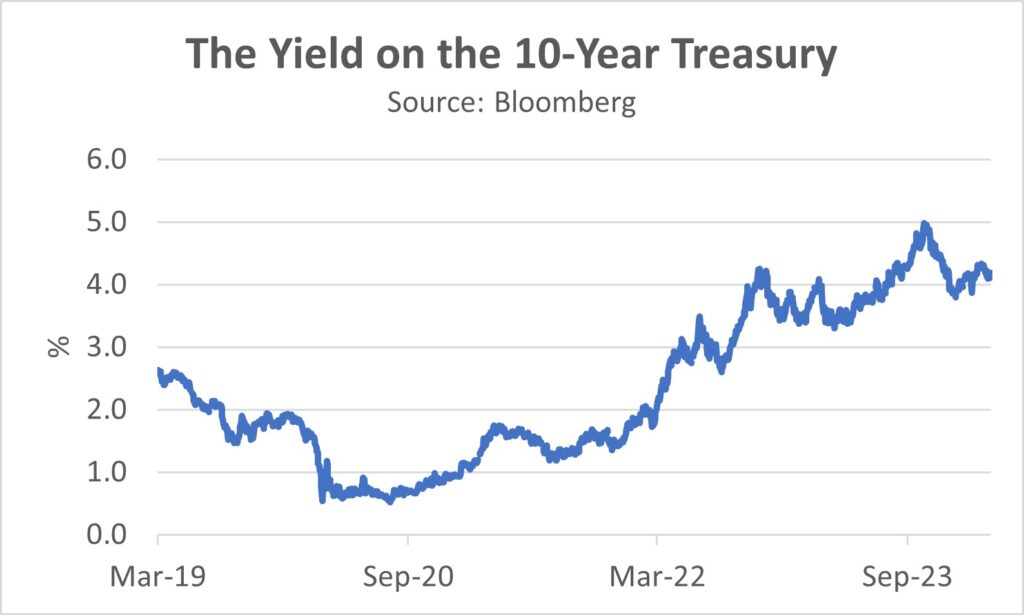
In response, Fed Chair Jerome Powell signaled a potential pause in rate hikes at the October 31- November 1 meeting of the Federal Open Market Committee. The central bank doubled down on this sentiment in the subsequent meeting by revising its 2024 year-end rate forecast, cutting its median target from 5.1% to 4.6%. Fueled by hopes of a dovish pivot from the Fed and a potential economic soft landing, investors heavily purchased long-term US Treasury bonds. This surge in demand contributed to a substantial drop in long-term yields, with the average 10-year yield plummeting nearly 80 basis points, dropping from 4.80% to 4.02% in just two months.[2] This significant decline in yields helped loosen financial conditions and relieved fears of a protracted increase in long-term interest rates.
However, the Fed’s dovish stance proved less aggressive than the market initially thought. As interest rates dropped below 4% on the 10-year Treasury, policymakers quickly signaled their opposition to an immediate cut. San Francisco Federal Reserve Bank President Mary Daly and Dallas FRB President Lorie Logan even suggested that further hikes remained a possibility. Fed Governor Waller, who opened the door to a spring rate cute, later emphasized the need for patience, indicating the committee wanted to see inflation continue its descent toward target levels. Chair Powell cemented this shift in stance at the January FOMC meeting, confirming that a March cut was not on the table. This hawkish pivot triggered a modest reversal in expectations over policy, causing the 10-year Treasury yield to rise by 15 basis points to 4.21%.
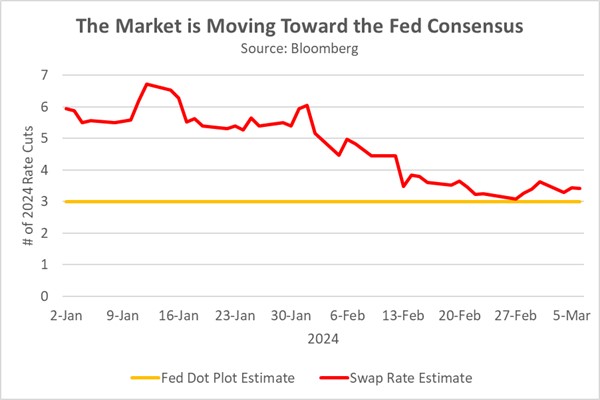
While the FOMC undoubtedly includes diverse viewpoints, the members’ recent pronouncements project a unified message. This cohesion amplifies the impact of forward guidance by minimizing misinterpretations. While individual views may differ, all members have publicly conveyed that current interest rates are likely near their peak, with rate cuts a possibility but not in the near-term. As a result, markets have revised their expectations, aligning with the median FOMC projection. Consequently, the moderation of policy rate expectations led to the stabilization of 10-year Treasury yields.
The Federal Reserve’s current approach, while not technically constituting yield curve control, may be a subtle form of it, which raises concerns about potential future interventions aimed at aligning with government priorities. The Fed’s use of “jawboning” to manage interest rate expectations raises questions about its potential shift toward a more active role in influencing market behavior. This could be particularly relevant considering the substantial US government debt and the alleged attempt of some officials to downplay the possibility of higher long-term rates in the future.
It’s important to note that forward guidance, while a tool for influencing expectations, is distinct from the yield curve control practiced during WWII, as it does not involve the expansion of the Fed’s balance sheet. If maintained over time and if seen as being implemented on the behest of the Treasury, this gray area could erode public confidence in the Fed’s independence. Such an impression could potentially hinder its ability to control inflation and negatively impact the value of the dollar. That said, we believe that if 10-year Treasury yields reach a range between 4.5% and 5.0%, it could present a buying opportunity for some investors.
View PDF
[1] The Federal Reserve Act mandates that the Federal Reserve conduct monetary policy “so as to promote effectively the goals of maximum employment, stable prices, and moderate long-term interest rates.”
[2] The Treasury’s decision to reallocate its bond issuance toward the short end of the yield curve also played a role in the drop.