

Business Cycle Report (March 25, 2021)
by Thomas Wash | PDF
The business cycle has a major impact on financial markets; recessions usually accompany bear markets in equities. The intention of this report is to keep our readers apprised of the potential for recession, updated on a monthly basis. Although it isn’t the final word on our views about recession, it is part of our process in signaling the potential for a downturn.
In February, the diffusion index rose further above the recession indicator, signaling that the recovery is continuing. Another round of fiscal stimulus elevated equities but led to a modest sell-off in Treasuries. Meanwhile, a slowdown in COVID-19 cases and easing restrictions made it easier to hire workers, thus last month saw an improvement in labor market conditions. However, poor weather conditions and supply constraints, particularly lack of semiconductors and lumber, led to a pullback in manufacturing and construction activity. As a result, four out of the 11 indicators are in contraction territory. The reading for February was unchanged from the previous month at +0.2727, above the recession signal of +0.2500.
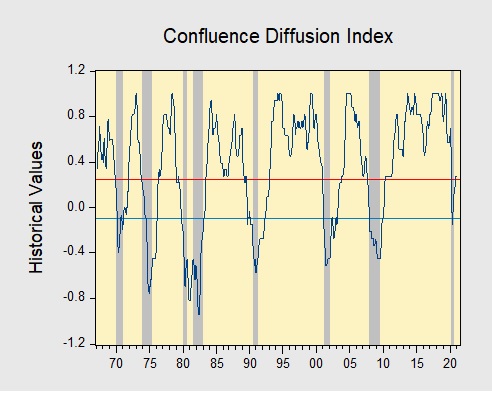
The chart above shows the Confluence Diffusion Index. It uses a three-month moving average of 11 leading indicators to track the state of the business cycle. The red line signals when the business cycle is headed toward a contraction, while the blue line signals when the business cycle is headed toward a recovery. On average, the diffusion index is currently providing about six months of lead time for a contraction and five months of lead time for a recovery. Continue reading for a more in-depth understanding of how the indicators are performing and refer to our Glossary of Charts at the back of this report for a description of each chart and what it measures. A chart title listed in red indicates that indicator is signaling recession.