

Weekly Energy Update (September 17, 2020)
by Bill O’Grady, Thomas Wash, and Patrick Fearon-Hernandez, CFA | PDF
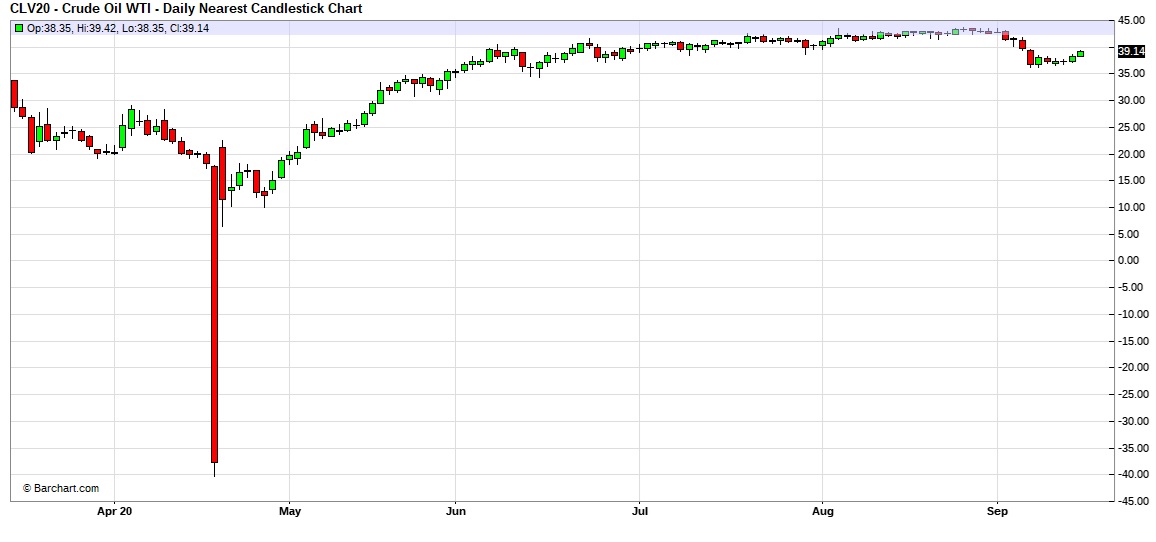
Here is an updated crude oil price chart. The recent dip in prices remains, although we are seeing some recovery.
Crude oil inventories fell when a rise was expected. Commercial stockpiles declined 4.4 mb compared to forecasts of a 2.3 mb rise. The SPR declined 2.1 mb; since peaking at 656.1 mb in July, the SPR has drawn 10.2 mb. Given levels in April, we expect that another 10.9 mb will be withdrawn as this oil was placed in the SPR for temporary storage. Taking the SPR into account, storage fell 6.5 mb.
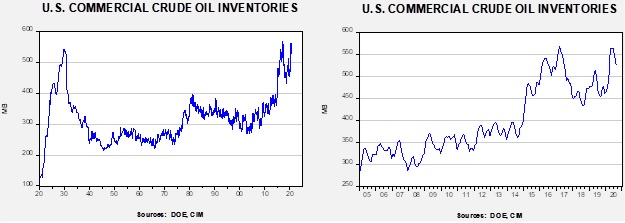
In the details, U.S. crude oil production rose 0.9 mbpd to 10.9 mbpd. Exports fell 0.3 mbpd, while imports rose 0.4 mbpd. Refining activity rose 4.0%.
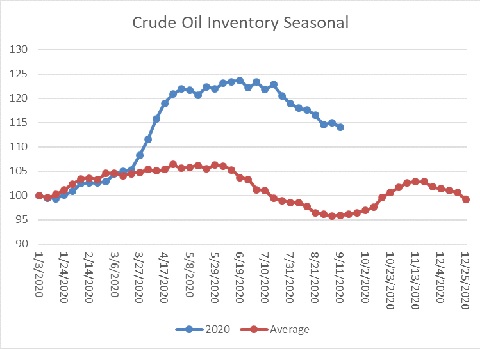
The above chart shows the annual seasonal pattern for crude oil inventories. This week’s data showed a decline in crude oil stockpiles. We are starting the seasonal build period. Stockpiles remain well above seasonal norms and remain a bearish factor.
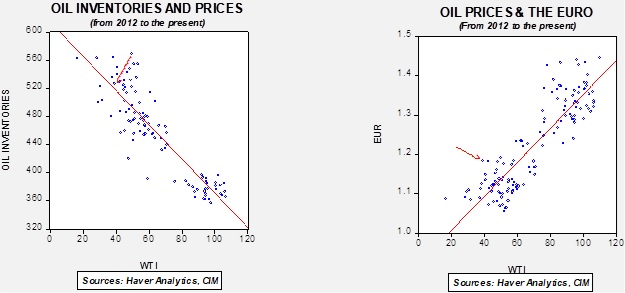
Based on our oil inventory/price model, fair value is $41.27; using the euro/price model, fair value is $64.17. The combined model, a broader analysis of the oil price, generates a fair value of $52.47. The wide divergence continues between the EUR and oil inventory models. As the trend in the dollar rolls over, it is bullish for crude oil. Any supportive news on reducing the inventory overhang could be very bullish for crude oil.
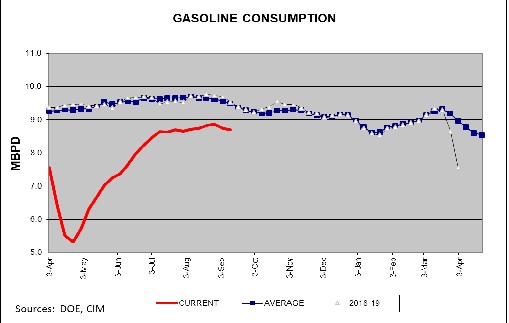
Gasoline consumption fell a bit this week. Seasonally, this is normal. Driving tends to slow as vacation season ends. As the chart shows, consumption declines slowly into mid-January. This year may be different; if a vaccine is developed that increases commuting then we could see driving rise, but without that result we should expect overall demand to fall through Q4.
On a long-term basis, we are seeing a profound decline in miles driven. This dovetails into the discussion below on peak oil demand.
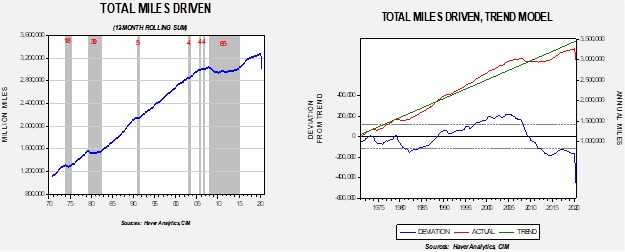
The chart on the left shows miles driven on a rolling 12-month basis. The gray bars indicate periods when the number didn’t make a new high. There were three periods of significant stalls in driving activity. The first two were a combination of recession and high oil prices. The last one was mostly due to the Great Financial Crisis, although the high oil prices in 2008 did play a minor role. Of course, the pandemic has caused a steep decline. The chart on the right shows a simple trend model. Driving fell below-trend in 2009 and has remained below-trend ever since. This decline in driving is part of the peak oil discussion.
This was the week of peak oil demand, and a number of sources, including BP (BP, 19.66), are warning that the world may be close to the maximum of oil consumption. Continued electrification of transportation and improved consumption efficiency in oil use are the primary factors in bringing the peak. Meanwhile, for this and next year, major data providers, including OPEC, are projecting weaker than previously forecast consumption.
As we have noted in earlier reports, the Trump administration has been caught between two constituencies, farmers and the oil industry. The former wants to force the refining industry to meet the goals set by the EPA for biofuel consumption. The latter wants to avoid them. For the most part, the administration has been granting waivers to refiners to allow them to use less biofuels than mandated. The administration has decided to void exemptions to small refiners; electorally, this decision boosts Iowa at the expense of Texas.