

Weekly Energy Update (May 21, 2020)
by Bill O’Grady, Thomas Wash, and Patrick Fearon-Hernandez, CFA
Here is an updated crude oil price chart. The oil market continues to show signs of recovery.
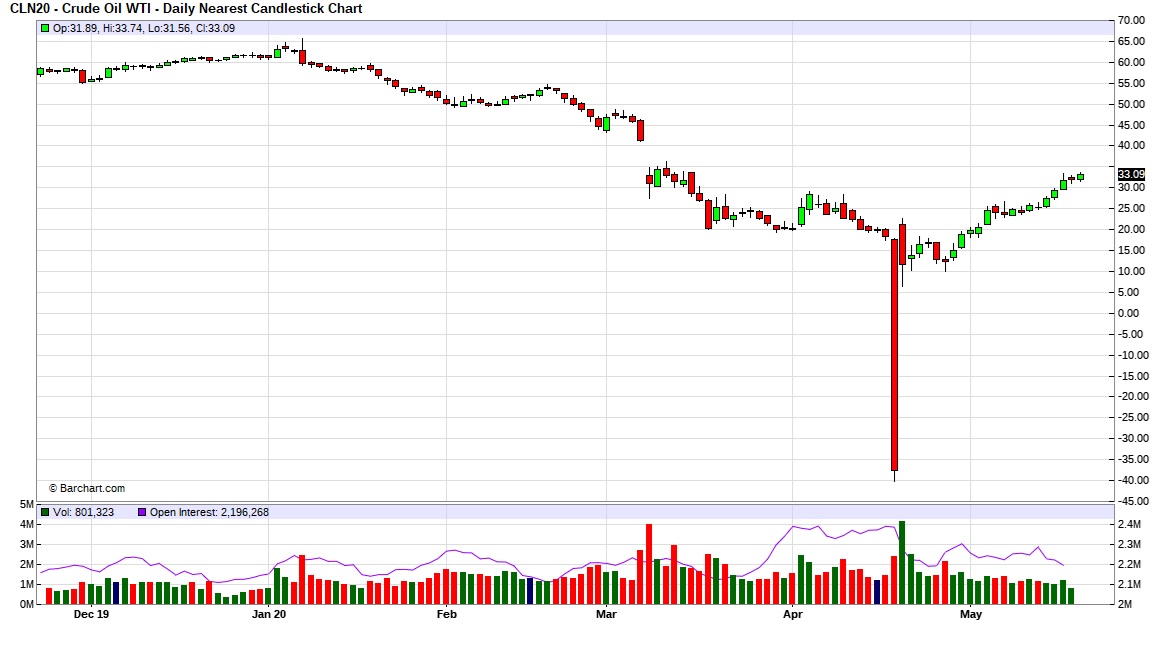
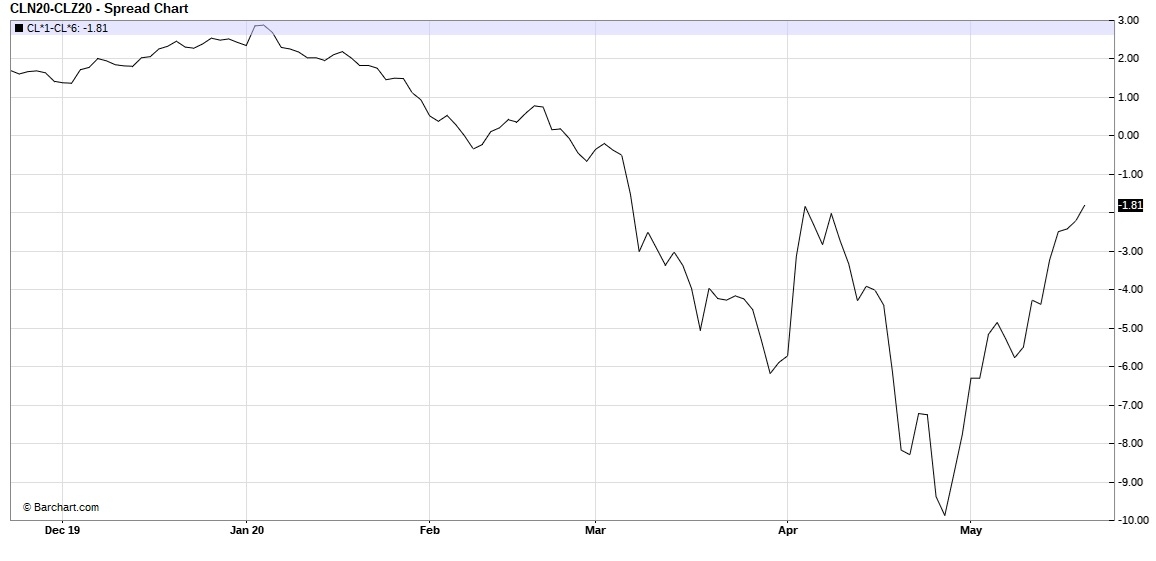
One interesting development has been in open interest. Open interest is the number of open contracts in a futures market. Most of the time, the highest open interest in the calendar of contracts is the nearby or the second nearby, when the first nearby is near expiration. However, currently the contract with the highest open interest is for December delivery. Investors are taking the stance that oil prices are likely to rise in the future due to the combination of improving economic growth and falling output. However, as the debacle recently witnessed in the oil ETFs showed, the nearest contracts are subject to wild price swings due to the lack of storage. Thus, it appears speculators and investors are moving to the longer-dated contracts to execute positions to avoid the problems inherent in the nearby contracts. The drawback with this strategy is that, under conditions of contango, the deferred prices are higher than the nearby. However, this disadvantage has narrowed recently. As the chart below shows, the July/December spread fell to nearly -10.00 per barrel in late April; it has narrowed to under -2.00 per barrel recently. Thus, the carrying cost of holding the deferred contract has become less onerous.
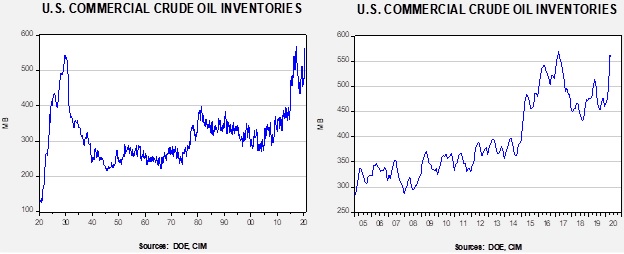
Crude oil inventories surprised the markets for the second straight week by falling 5.0 mb compared to the forecast rise of 2.0 mb.
In the details, U.S. crude oil production fell 0.1 mbpd to 11.5 mbpd. Exports fell 0.3 mbpd, while imports fell 0.2 mbpd. Refining activity rose 1.5%, in line with expectations. As we saw last week, there was another jump in unaccounted-for crude oil.
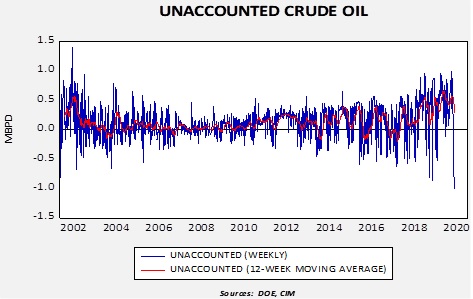
Unaccounted-for crude oil is a balancing item in the weekly energy balance sheet. To make the data balance, this line item is a plug figure; but that doesn’t mean it doesn’t matter. This week’s number of -998 kbpd is the largest negative number on record. It may mean that in the scramble for finding storage, some oil is being inventoried outside the survey system. In other words, over the week, some 6.9 mb of crude oil went into storage somewhere, just not where it can be recorded. Or, production is falling much faster than the DOE estimates are capturing so there aren’t any missing barrels; simply put, production is cratering. We are leaning toward the first explanation, but if inventories don’t rise in the coming weeks the second theory would become more plausible. The second factor is that the SPR rose 1.9 mb as some of the oil went into the strategic reserve.
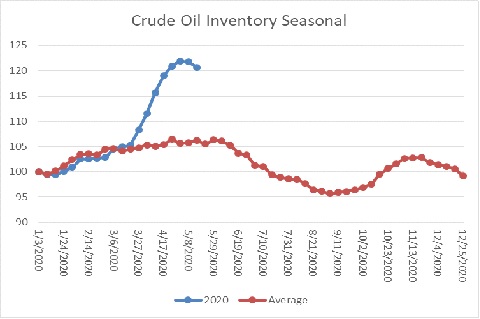
The above chart shows the annual seasonal pattern for crude oil inventories. This week’s data, with the caveats expressed in the discussion about the unaccounted-for crude oil, suggests the worst of the inventory accumulation is behind us.
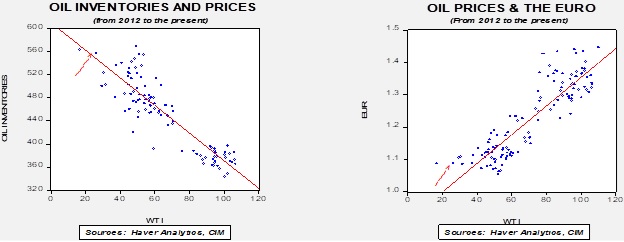
Based on our oil inventory/price model, fair value is $30.89; using the euro/price model, fair value is $44.26. The combined model, a broader analysis of the oil price, generates a fair value of $36.88. As we noted recently, the model output is less relevant as there is a non-linearity tied to the loss of storage capacity that cannot be fully captured with these models. At the same time, if storage remains available, the models would suggest further upside for oil prices.
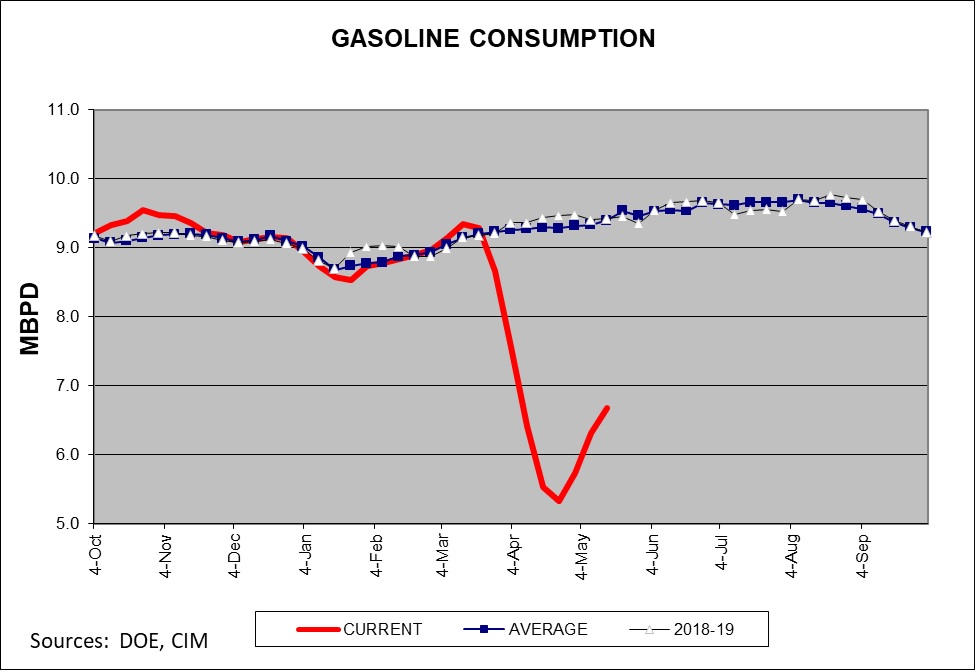
Although consumption remains depressed, there are reports that driving is starting to recover as lockdown rules ease. The gasoline supplied data on the chart below also continues to show improvement. Some data tracking does suggest an upswing in driving activity.
The market news for the week was mixed. As we noted above, demand does appear to be improving, but prices remain depressed and production will likely continue to fall. The Dallas FRB has produced research suggesting the net effect of the oil bear market has been negative for the economy, a major reversal from past years, reflecting the growing importance of oil production to the overall economy. Meanwhile, it is possible the U.S. will restrict Chinese oil firms from buying U.S. oil companies. And, in a first, the U.S. is on track to generate more electricity from renewables compared to coal.
On the geopolitical front, we are seeing the U.S. and Iran ease tensions. Washington appears to be ignoring Iran’s trading with Venezuela, for example. We suspect Tehran does not want to trigger a conflict before the election, a move that might actually boost support for President Trump. Saudi Arabia is trying to balance the goals of economic restructuring with the loss of revenue due to falling oil prices. Argentina has set a domestic price of $45 per barrel to protect domestic producers.