

Weekly Energy Update (May 14, 2020)
by Bill O’Grady, Thomas Wash, and Patrick Fearon-Hernandez, CFA
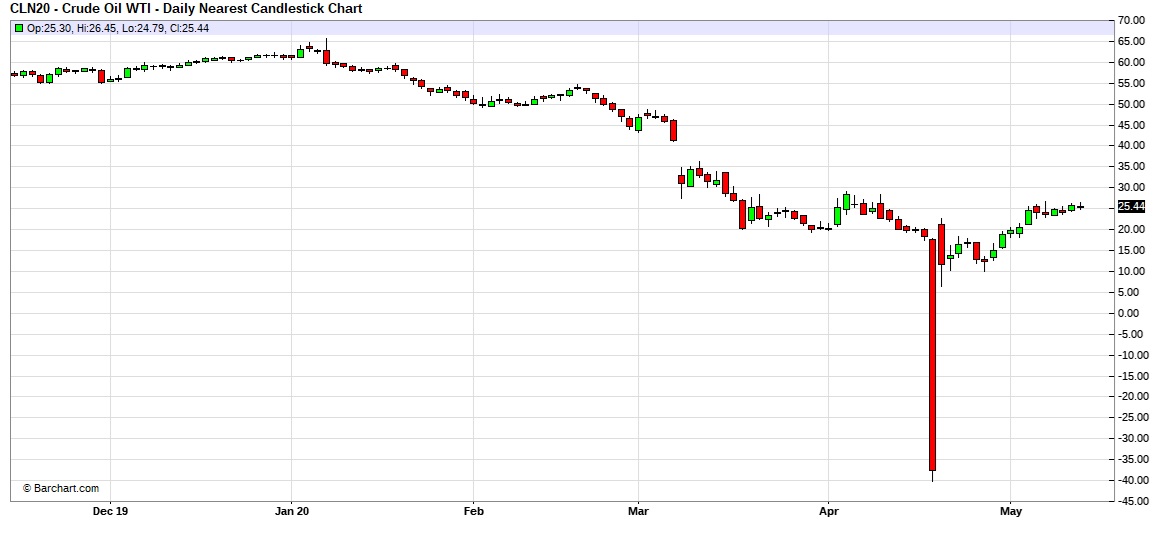
Here is an updated crude oil price chart. The oil market continues to show signs of recovery.
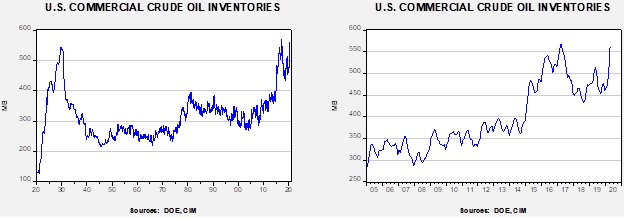
Crude oil inventories surprised the markets by falling 0.7 mb compared to the forecast rise of 5.0 mb.
In the details, U.S. crude oil production fell 0.3 mbpd to 11.6 mbpd. Exports were unchanged, while imports fell 0.3 mbpd. Refining activity fell 2.6%, when a modest rise was expected.
So, why the unexpected inventory draw?
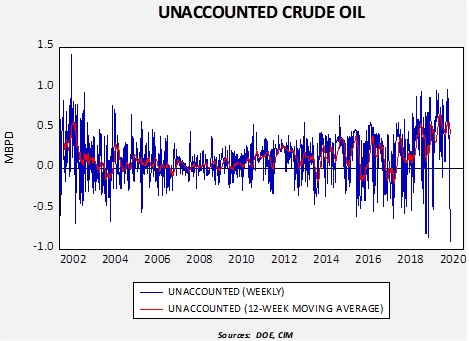
Unaccounted for crude oil is a balancing item in the weekly energy balance sheet. To make the data balance, this line item is a plug figure; but that doesn’t mean it doesn’t matter. This week’s number of 914 kbpd is the largest negative number on record. It may mean that in the scramble for finding storage, some oil is being inventoried outside the survey system. In other words, over the week, some 6.4 mb of crude oil went into storage somewhere, just not where it can be recorded. This explanation would be consistent with the build seen in the API data. Or, production is falling much faster than the DOE estimates are capturing so there aren’t any missing barrels; simply put, production is cratering. We are leaning toward the first explanation, but if inventories don’t rise in the coming weeks the second theory would become more plausible. The second factor is that the SPR rose 1.9 mb as some of the oil went into the strategic reserve.
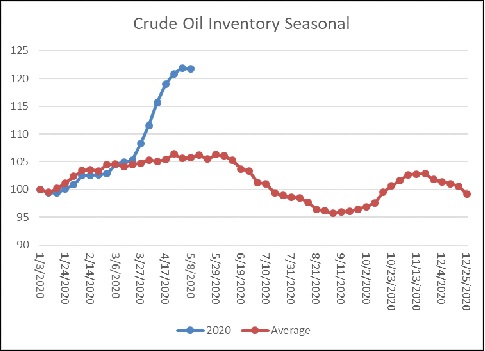
The above chart shows the annual seasonal pattern for crude oil inventories. This week’s data, with the caveats expressed in the discussion about the unaccounted-for crude oil, suggests the worst of the inventory accumulation is behind us.
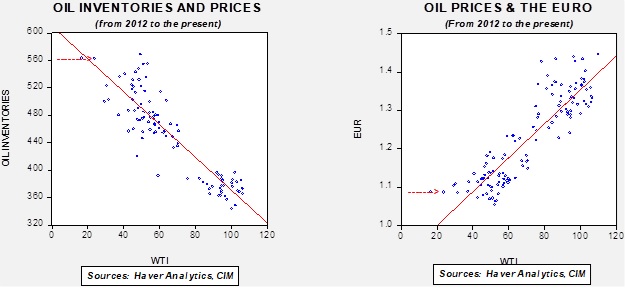
Based on our oil inventory/price model, fair value is $29.17; using the euro/price model, fair value is $44.14. The combined model, a broader analysis of the oil price, generates a fair value of $36.98. As we noted recently, the model output is less relevant as there is a non-linearity tied to the loss of storage capacity that cannot be fully captured with these models. At the same time, if storage remains available, the models would suggest upside for oil prices. We also note that the Eurozone could be roiled by German court decisions that might limit the flexibility of the ECB to support the Eurozone economy. This outcome would be bearish for the euro and may weaken it further, which would be bearish for oil prices.
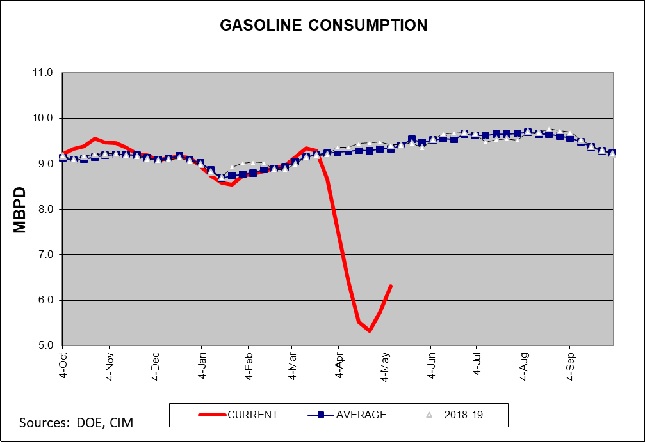
Although consumption remains depressed, gasoline data does show improvement. Some data tracking does suggest an upswing in driving activity.
The news for the week was mixed. On the positive side for oil prices, the UAE announced production cutbacks. The DOE’s short-term forecast indicated that demand should start to recover and supplies should fall as the year progresses. On the negative front, OPEC cut its crude oil demand forecast for 2020 by 2.0 mbpd. Oil CEOs are warning that oil may be witnessing peak demand.
On the geopolitical front, Iran’s Khuzestan province is implementing social distancing to thwart a rise in COVID-19 infections. Iran has been breaking U.S. sanctions, sending oil to Syria and oil equipment to Venezuela. U.S. sanctions are reducing funding for Iranian proxies and forces in Syria. Saudi Arabia is being forced to implement austerity measures to deal with the drop in oil prices. Finally, the U.S. has pulled Patriot missile batteries from Saudi Arabia.