Weekly Energy Update (March 12, 2020)
by Bill O’Grady, Thomas Wash, and Patrick Fearon-Hernandez, CFA
Crude oil inventories rose 7.7 mb compared to the forecast rise of 1.7 mb.
In the details, U.S. crude oil production fell 0.1 mbpd to 13.0 mbpd. Exports fell 0.7 mbpd, while imports rose 0.2 mbpd. The inventory build was more than forecast due to falling exports and rising imports.
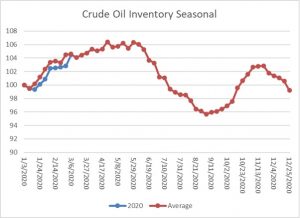
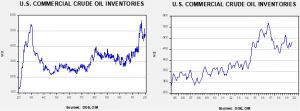
This chart shows the annual seasonal pattern for crude oil inventories. This week’s report rose to seasonal norms. Inventories will be expected to rise steady into late May. We will be watching the above chart closely in the coming weeks for signs that inventories are rising abnormally due to the market share war described below.
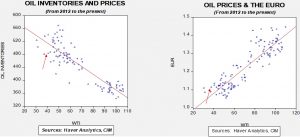
Based on our oil inventory/price model, fair value is $56.46; using the euro/price model, fair value is $53.22. The combined model, a broader analysis of the oil price, generates a fair value of $53.57. The model has lifted its fair value calculations due to dollar weakness; however, under current circumstances, the model output is less relevant unless Russia and the Kingdom of Saudi Arabia (KSA) come to an agreement on supply.
The big news in oil is the market share war that has emerged from the recent OPEC+Russia meeting. The KSA was unable to convince Russia to contribute to supply restrictions and Riyadh has announced an all-out supply war. Prices plunged this week in response.
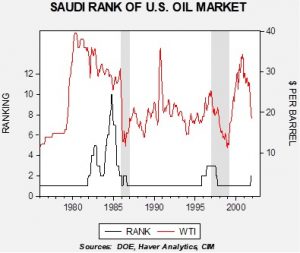
The following two charts show the KSA’s thinking. The Saudis have, in their history, had one market they keyed on where they wanted either to be the largest or second largest supplier. In the 1970s through the 1990s, that market was the U.S. There were two reasons for this. The U.S. was the largest importer of crude oil and provided security for the KSA. Thus, the kingdom did not want to lose share in the U.S. because (a) it was the most important market in the world, and (b) it feared the U.S. would view providing security as less critical if the KSA was seen as less important. During two previous market share wars, in 1986 and 1997-99, the loss of share was a triggering event. The chart below shows WTI along with the Saudi rank as foreign supplier to the U.S. market. The gray bars are designated as market share wars.
Until 1986, the KSA acted as “swing producer” for OPEC.[1] This led to a near-catastrophic loss of market share in the U.S. In December 1985, the KSA signaled it was abandoning the swing producer role and would retake market share. Oil prices fell from the low $30s to near $10 per barrel before the rest of OPEC capitulated and agreed to output cuts. In the mid-to-late 1990s, the KSA was losing market share in the U.S. to Venezuela, which had invited foreign company oil investment in order to boost output capacity. The KSA retaliated with supply increases into the Asian Financial Crisis. Prices fell from the mid-$20s to near $10. The war ended when Venezuelan President-elect Hugo Chavez signaled an end to the supply war, eventually ending the policy of using foreign investment to lift capacity. Prices rapidly recovered.
This time around, the U.S. is not the target of the KSA. The U.S. has made it clear that it is reducing its security footprint in the Middle East and, with the onset of shale production and a “captured” Canadian oil market,[2] the KSA can’t really defend its U.S. share. Instead, it has staked its future on rising Chinese oil demand, and likely hopes that, at some point, it will be able to receive security support from China as well.[3] Therefore, the KSA is committed to be the preeminent oil supplier to Beijing. Russia is threatening that position.
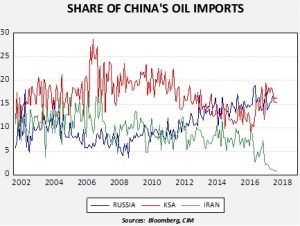
This chart shows the share of China’s oil imports from the KSA, Russia and Iran. From 2006 to 2012, the KSA held a dominant share. But, since 2014 (when the KSA reversed its policy on trying to drive down shale oil production via lower prices), Russia’s share has been competing with the KSA.
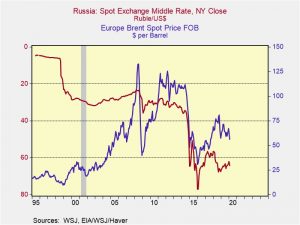
So, given this background, how do we expect this to play out? Most OPEC nations are rentier states; they use revenue from oil to support government spending. In addition, these nations tend to suffer from the “Dutch disease,” a condition where a commodity export tends to boost exchange rates, making domestic industries less competitive. This process tends to lift imports and consumers become used to low-priced goods from abroad. As a result, currency depreciation tends to be politically unpopular. When the KSA fought for market share in the past, its competitors tended to avoid currency depreciation, which is an effective buffer to the costs of the market share war. In other words, a foreign oil company sells its product for dollars but pays its workers in local currency. If the currency depreciates, then its production costs compared to output prices decline. Russia has shown a tendency to depreciate the RUB when oil prices decline. The next chart shows that tendency.
This chart shows Brent crude oil prices and the RUB/USD exchange rate (inverted scale). Note that as oil prices decline, the RUB falls with it. If Russia engages in similar behavior, it will give it more “staying power” in the share war.
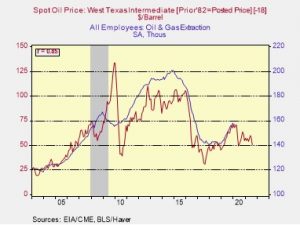
How much will this event affect employment? In the oil patch, it will be signficant.
Assuming we see $25 WTI, we will likely see nearly 40k jobs lost in oil and gas extraction. But, as the chart shows, it will take about 18 months to occur.
The bottom line is that this share war will likely get rather ugly. The KSA is pushing supply into the world market and it has no place to go. The U.S. oil industry will suffer greatly, but production probably won’t start to decline until autumn, when price hedges will likely roll off. Iran will also be crushed by this move; the little oil it is selling will fall dramatically in price. We look for prices to fall into the low $20s in the coming months.
[1] A swing producer adjusts output to fix a price.
[2] Canada’s pipeline system is limited, so most of its output ends up in the U.S. market. This means, at least in terms of the oil market, that Canadian production can be thought of as U.S. supply.
[3] This is a bit of a pipedream. Although China’s military is growing rapidly, it is still years away from being able to project power beyond its borders.


