Weekly Energy Update (June 4, 2020)
by Bill O’Grady, Thomas Wash, and Patrick Fearon-Hernandez, CFA
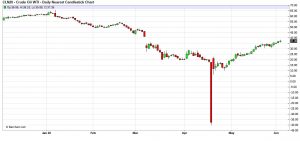
Here is an updated crude oil price chart. The oil market continues to recover after April’s historic collapse.
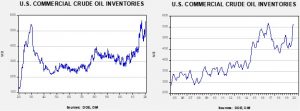
Crude oil inventories surprised the markets for the fourth straight week with stockpiles falling 2.1 mb compared to forecasts of a 3.0 mb build.
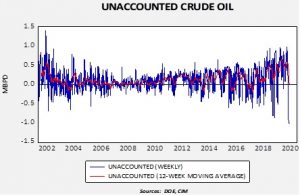
In the details, U.S. crude oil production fell 0.2 mbpd to 11.2 mbpd. Exports fell 0.4 mbpd, while imports declined 1.0 mbpd. Refining activity rose 0.5%, a bit below expectations. As we saw last week, there was another jump in unaccounted-for crude oil.
Unaccounted-for crude oil is a balancing item in the weekly energy balance sheet. To make the data balance, this line item is a plug figure, but that doesn’t mean it doesn’t matter. This week’s number of -1.01 mbpd is the largest negative number on record. For the fourth week in a row, this number is running nearly 1.0 mbpd. The 12-week average is on the verge of going negative for the first time since October 2017. It may mean that in the scramble for finding storage, some oil is being inventoried outside the survey system. This week, the SPR took 4.0 mb, but that doesn’t resolve the unaccounted-for crude issue. This week, some 7.0 mb of crude oil went into storage somewhere, just not where it can be recorded. Or, production is falling much faster than the DOE estimates are capturing so there aren’t any missing barrels; simply put, production is cratering. We still don’t know which thesis is correct. However, given the persistence in the unaccounted number, it is looking increasingly likely the DOE is overestimating production.
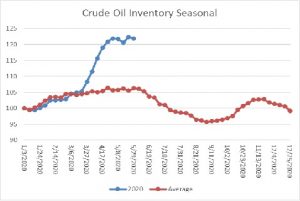
The above chart shows the annual seasonal pattern for crude oil inventories. This week’s data showed a modest decline in crude oil stockpiles. We are getting close to the beginning of the seasonal draw for crude oil. If inventories don’t decline in the coming weeks, oil prices would be vulnerable to a correction.
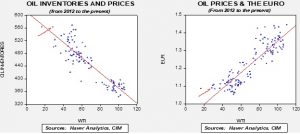
Based on our oil inventory/price model, fair value is $29.12; using the euro/price model, fair value is $45.01. The combined model, a broader analysis of the oil price, generates a fair value of $36.57. It does appear that the worries over storage capacity have been resolved, so the model is more reliable. We have been seeing a steady drop in the dollar recently. The Eurozone is considering a mutualized debt instrument to pay for COVID-19 costs. It is possible the Eurozone may use this event to create a permanent mutualized Eurobond which would make the EUR an attractive alternative to the dollar for reserve purposes. A weaker dollar would be bullish for oil prices.
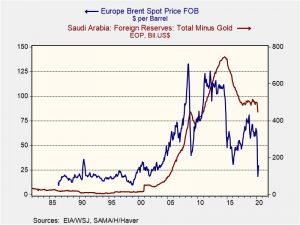
In energy news, the Kingdom of Saudi Arabia (KSA) moved liquidity from its foreign reserves to its sovereign wealth fund. The fund has been aggressively buying assets overseas, viewing the current weakness caused by the virus as a buying opportunity. Foreign reserves act as a buffer to low oil prices and so a decline in reserves may force additional austerity measures on the populous.
This chart shows the KSA’s foreign reserves and Brent oil prices. Lower oil prices tend to reduce reserve levels with a lag. Thus, the decision to shift funds to the soverign wealth fund may reflect the idea that oil prices will rebound quickly.
In OPEC news, there are doubts the cartel will hold an early meeting. This news eased prices modestly. We expect the cartel and Russia will maintain production cuts for at least another month. Venezuela says it will increase gasoline prices, a risky move for a nation with heavily subsidized petrol.
VP Biden is considering new climate proposals; if elected, these measures may reduce oil production. The Trump administration has reduced states’ ability to regulate energy companies; that may reverse under a Biden government.
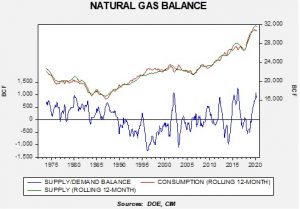
This week, we want to discuss the natural gas market. May is the “shoulder month” for demand. As summer unfolds, demand for electricity tends to rise and, if temperatures are high enough, helps boost natural gas prices. First, here is the supply/demand balance.
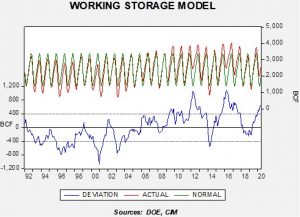
Currently, there is a rather wide supply imbalance, with supply outpacing consumption. Under these conditions, inventories tend to accumulate. The chart below shows seasonally adjusted working natural gas storage. Inventory levels are well above normal as we head into summer.
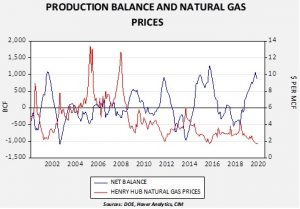
One bright spot is that the supply/consumption balance is showing some improvement. If we see hot weather in the coming weeks, it should allow the inventory overhang to dissipate and support prices. Another bullish factor is that falling oil production will reduce associated natural gas production, which should help narrow the inventory overhang. However, any bullish scenario rests on an unusually hot summer. The current summer forecast is leaning hot, so there is the potential for a price recovery in the coming weeks.


