

Weekly Energy Update (June 25, 2020)
by Bill O’Grady, Thomas Wash, and Patrick Fearon-Hernandez, CFA
(NB: Due to the upcoming Independence Day holiday, the next report will be published on July 9.)
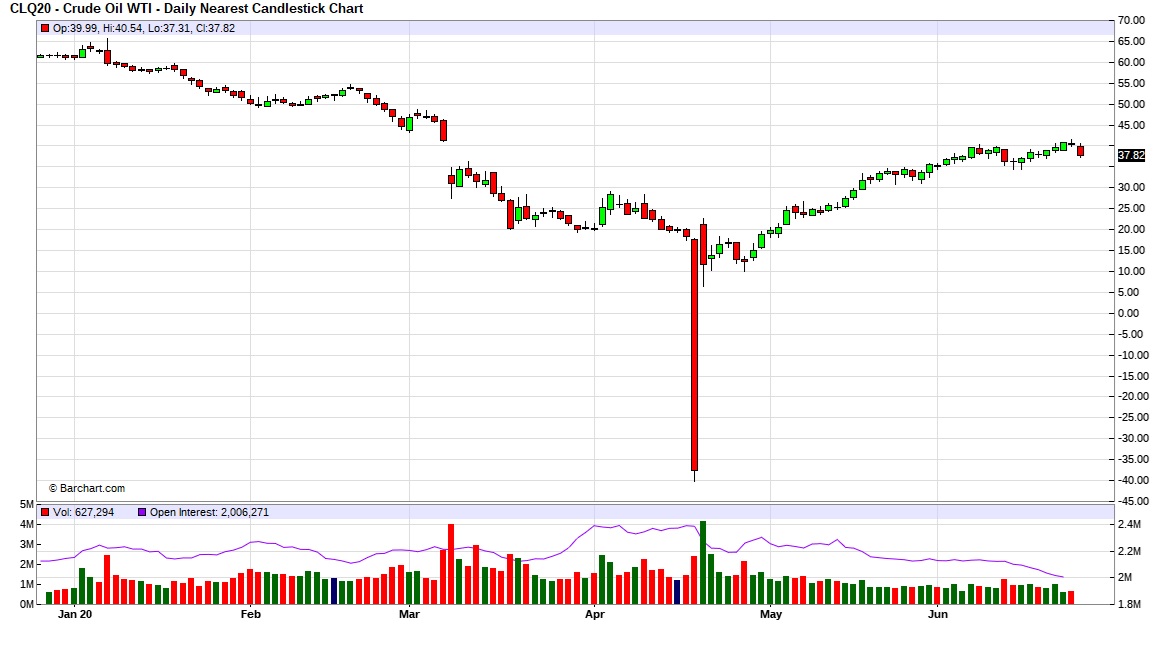
Here is an updated crude oil price chart. The oil market has stabilized at higher levels after April’s historic collapse.
Crude oil inventories rose less than market expectations, with stockpiles rising 1.4 mb compared to forecasts of a +2.0 mb build. The SPR added 2.0 mb this week.
In the details, U.S. crude oil production rose 0.5 mbpd to 11.0 mbpd. Exports rose 0.7 mbpd, while imports fell 0.1 mbpd. Refining activity rose 0.8%, modestly higher than expected. After major declines for the past several weeks, the level of unaccounted-for crude oil recovered sharply this week.
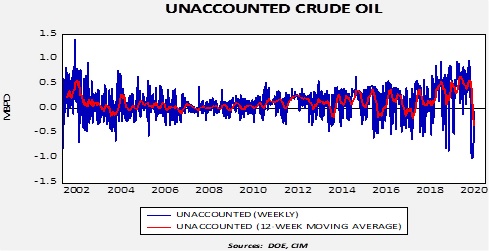
Unaccounted-for crude oil is a balancing item in the weekly energy balance sheet. To make the data balance, this line item is a plug figure, but that doesn’t mean it doesn’t matter. This week’s number is -53 kbpd. This is a very small number and suggests the DOE is getting the data fixed. The rise in production suggests that the unaccounted-for crude oil data was being affected more by crude oil stored in areas unreported, although falling output addressed some of this figure as well.
We have been seeing oil flow into the Strategic Petroleum Reserve (SPR) in recent weeks. The government is offering storage in the SPR to relieve inventory constraints. The chart below shows the history of the level of inventory in the SPR by party holding the White House.
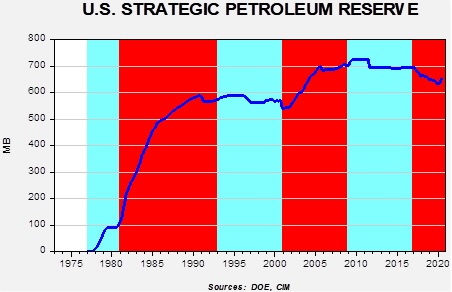
Although President Carter was an exception, in general, Republicans have tended to build the SPR, while Democrats have held it mostly steady. This may be due, in part, to the fact that the GOP tends to favor the energy industry. President Trump has not followed that pattern until recently. We do expect these injections to be temporary as the rise is due to aiding the industry and not a deliberate policy to increase the stockpile. But, since mid-April, 18.8 mb have gone into the SPR, easing bearish price pressures.
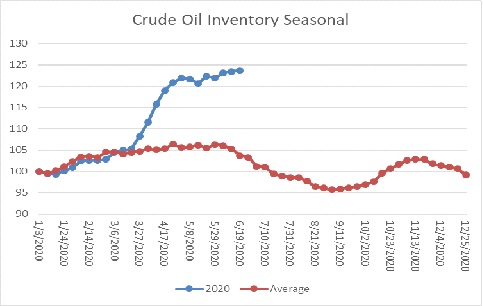
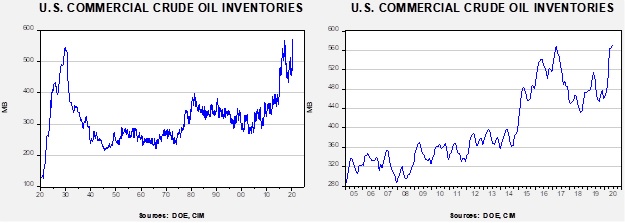
The above chart shows the annual seasonal pattern for crude oil inventories. This week’s data showed another modest rise in crude oil stockpiles. We are in the beginning of the seasonal draw for crude oil. The continued rise in inventories is bearish for prices.
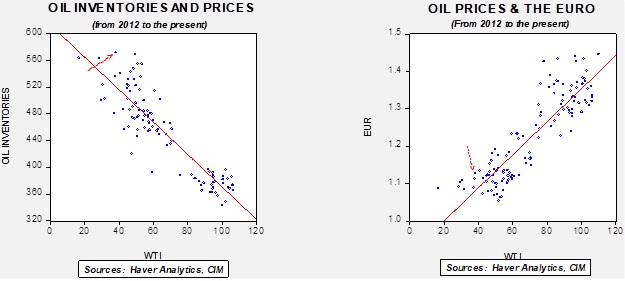
Based on our oil inventory/price model, fair value is $26.85; using the euro/price model, fair value is $52.56. The combined model, a broader analysis of the oil price, generates a fair value of $39.99. We are starting to see a wide divergence between the EUR and oil inventory models. The weakness we are seeing in the dollar, which we believe may have “legs,” is bullish for crude oil and may overcome the bearish oil inventory overhang.
Gasoline consumption remains below average, but the recovery is unmistakable.
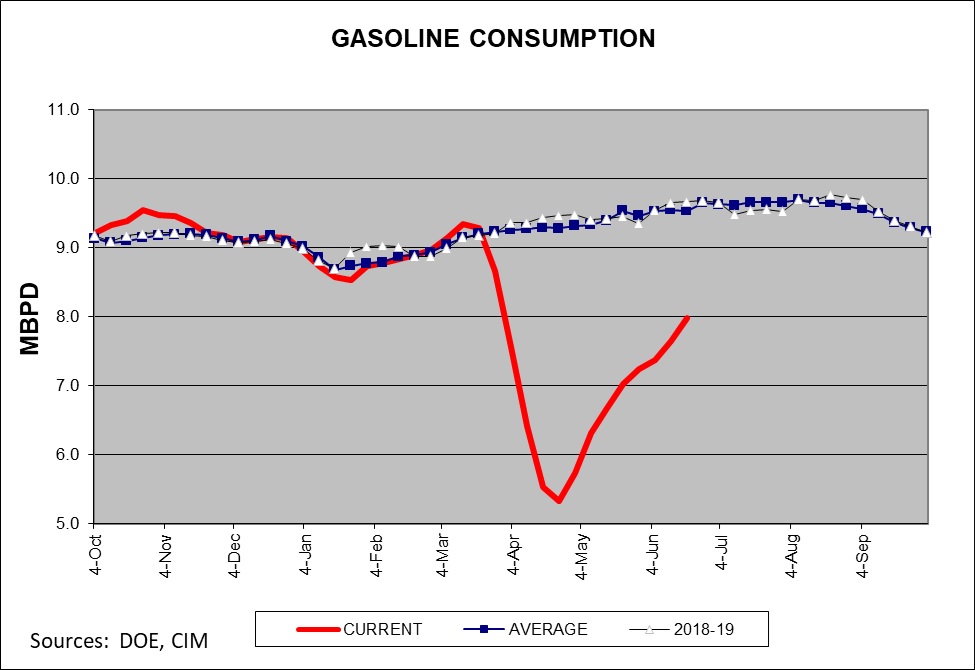
Still, the refining industry is continuing to struggle, and without improvement in this sector the demand for crude oil could stall in the coming weeks.