

Weekly Energy Update (June 16, 2022)
by Bill O’Grady, Thomas Wash, and Patrick Fearon-Hernandez, CFA | PDF
Crude oil prices continue to rise in an orderly fashion.
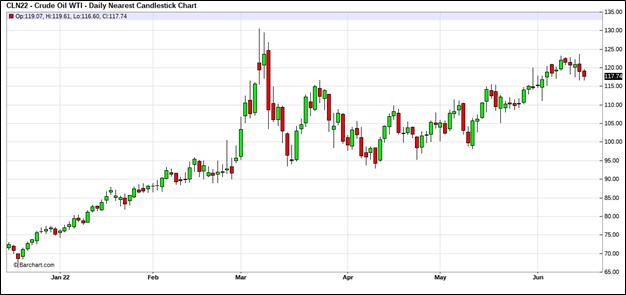
(Source: Barchart.com)
Crude oil inventories rose 2.0 mb compared to a 2.0 mb draw forecast. The SPR declined 7.7 mb, meaning the net draw was 5.8 mb.
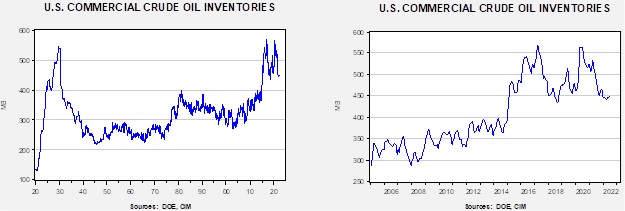
In the details, U.S. crude oil production rose from 0.1 mbpd to 12.0 mbpd. Exports rose 1.5 mbpd, while imports rose 0.8 mbpd. Refining activity fell 0.5% to 93.7% of capacity.
(Sources: DOE, CIM)
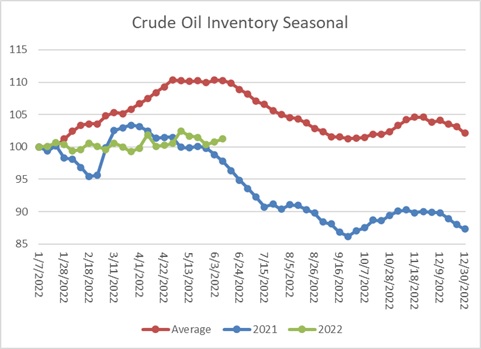
The above chart shows the seasonal pattern for crude oil inventories. This week’s report is consistent with the average pattern. Note the average pattern shows declines into September.
Since the SPR is being used, to some extent, as a buffer stock, we have constructed oil inventory charts incorporating both the SPR and commercial inventories.
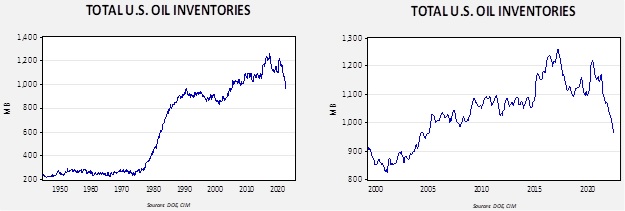
Total stockpiles peaked in 2017 and are now at levels seen in 2005. Using total stocks since 2015, fair value is $97.79.
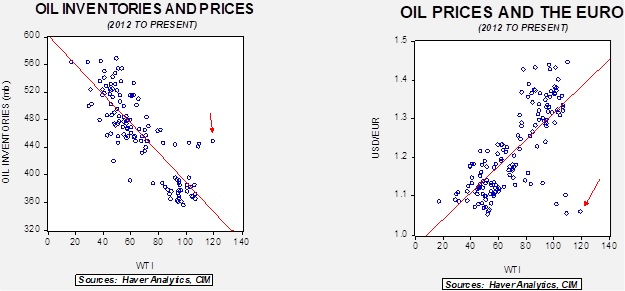
With so many crosscurrents in the oil markets, we see some degree of normalization. The inventory/EUR model suggests oil prices should be around $65 per barrel, so we are seeing about $50 of risk premium in the market.
Natural Gas Update:
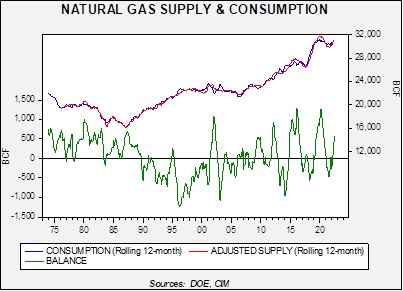
As we head into summer, we wanted to look at current natural gas fundamentals. First, on a rolling 12-month basis, supply exceeds consumption.
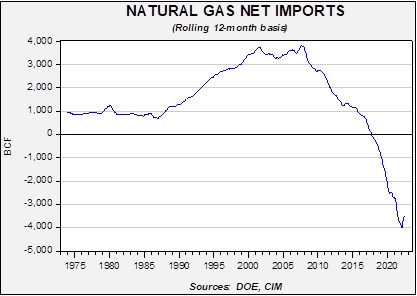
The improved supply situation for the U.S. is partly due to rising production; however, we have also seen lower exports. Given the U.S. promises to Europe, we look for exports to rise as the summer wears on.
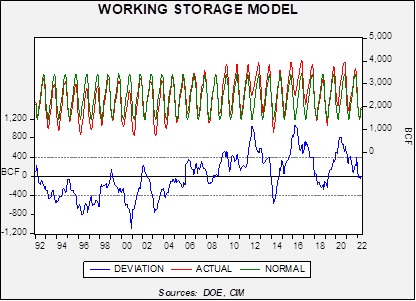
For now, inventories are balanced as we move into summer. We are in the injection season and thus, expect inventories to rise into November.
This model compares working storage to the estimated normal level. We will be watching this model closely over the summer.
Market news:
- The Biden administration is attacking the energy industry.
- Senator Wyden (D-OR) is proposing a 21% surtax on oil company profits considered “excessive,” applied to companies with over $1.0 billion in revenue. This tax would be in addition to normal taxes. Any profit exceeding 10% would be surtaxed. It is not clear if this legislation would pass. We doubt any GOP senators would vote for it, and Senator Manchin (D-WV) would probably oppose it as well. Windfall profit taxes are commonly proposed during periods where energy prices are elevated. The rationale is that high energy prices cause pain; the political class wants capital to bear some of the cost. We note similar taxes have been proposed in the U.K. The economics of such taxes are sketchy. In general, taxing something means getting less of it. Taxing oil company profits will not increase supply. Most likely, Wyden wants to focus voter anger on the oil companies instead of Democratic party policy.
- A more formidable risk comes from the White House, which is threatening direct measures against the oil companies. The moves are outlined in this letter. S. Refining capacity has been stagnant for years in the U.S. The last new refinery of significant size was completed in 1976. There have been small additions to capacity, usually built around existing facilities. In general, refinery utilization runs between 80% to 95% of capacity, with the high end occurring in the summer. Moving above 95% invites trouble. It is not uncommon to see refinery accidents and explosions if the system runs above 95% for any length of time. The president is threatening actions, although realistically, there isn’t much he can do. Even if he took the position, ala’ Hugo Chavez, and nationalized the refiners, he couldn’t get out much more product. Nationalizing could force the refiners to run at zero profits, which is what I suspect is his ultimate goal. The refining industry is facing a terrible future. The administration has taken an anti-fossil fuel position for environmental reasons, which is justifiable. But, if you set a policy in place, you must bear the consequences.
- Although the actions and attitudes described above are understandable, the overall outcome probably won’t matter. The president and his party are gambling that blaming the oil companies will be a political strategy to blunt Americans’ anger over high prices. To quote a famous movie…”it’s a bold strategy, Cotton. Let’s see if it pays off for them.”
- As we discuss below, the president is off to the Middle East next month, ostensibly to ask the KSA for more oil. The political optics are terrible. Instead of visiting Texas or Alberta and engaging these sources for more energy, he will visit the Crown Prince Salman, a man the president described as a “pariah,” a leader who murders journalists.
- We are closely monitoring the natural gas market. A couple of factors are driving the market.
- We are seeing an early summer heat wave. Last week, the Rockies were dealing with excessive heat, and that heat dome is now moving over the Midwest. Here in St. Louis, the entire week is expected to be over 90o, with at least three days over 100o. In a normal summer, St. Louis has three days of over 100o. The severity of these events is leading forecasters to give heat waves names like we do hurricanes. High temperatures boost air conditioning use, and since most peaking power units are fired by natural gas, heat waves lift natural gas demand. We have already seen record electricity demand in Texas. What is concerning is that this is only June; July and August are usually warmer, so we could be in for a very long, hot summer. We expect brownouts and blackouts to occur if temps remain elevated.
- Last week, a fire at an LNG plant in Texas roiled the market. S. prices fell as the loss of the plant will temporarily lift supplies here. The news got worse as plant managers indicated the repairs would take closer to three months instead of three weeks. However, it sent EU prices higher, as the disruption will reduce LNG exports. Prices were already ticking higher as summer arrived in Europe and Russia cuts supplies further. This plant produces about a fifth of U.S. LNG, so the loss is a major problem. LNG imports to Europe are increasing but still are expected to be tight this winter. Before this event, there were concerns about natural gas supplies in Europe; the chances of rationing increased due to the fire.
- Drought continues to reduce western U.S. hydroelectric power, likely boosting demand for natural gas.
- Another U.S. oil refinery is set to close in 2023. Diesel fuel prices are hitting records, and gasoline is averaging $5.00 per gallon. Crude oil prices remain below their all-time highs.
- S. oil firms remain reluctant to lift production, especially with talk of a windfall profits tax.
- Although it has caught little attention, there are reports that OPEC+ is considering removing all production targets in August. This would allow the cartel to produce full-out. For most of the oil market’s history, some cartel body has restricted supply. Market intervention was to prevent reservoir destruction. Restricting output led to higher than market prices but also brought less volatility. It is because the cartel always had some reserve capacity it could bring to market when prices surged. If we are running out of spare capacity, not only could oil prices move much higher, but price volatility could soar. The combination of less than advertised capacity within OPEC and the likely permanent loss of Russian supplies could lead to a high price/high volatility oil market.
- The U.S. and EU are trying to create a situation where the world could still take Russian crude oil but reduce how much Russia could earn on the sales via price caps. The idea is to create an oligopsony of buyers that would cap the price of Russian oil. However, that outcome is already occurring to some extent, as evidenced by the widespread of Urals oil to Brent.
- PDVSA, the Venezuelan state oil company, is demanding prepayment for oil sales. Apparently, some buyers are taking crude oil from Venezuela and then not paying for the product.
- As global supplies tighten, there is a renewed interest in Canadian tar sands. Given the adverse environmental impact, the interest suggests that high prices are overcoming environmental concerns.
- China is turning to coal power as the prices of other sources rise.
Geopolitical news:
- Although the JCPOA talks continue, the news surrounding the talks continues to weaken the case for a resumption of the nuclear deal. Last week, we learned Iran shut off monitoring cameras on its nuclear facilities, and following censure by the IAEA, dismantled the devices. Iran has publicly questioned the IAEA’s impartiality; if this U.N. body can’t be trusted, there is little the world can do to contain nuclear proliferation. Iran did offer last-minute meetings to try to stave off censure, but this action failed, further undermining confidence that Iran isn’t on the path to a nuclear weapon. Our position has been that there was little chance of a resumption of the nuclear deal, and so far, we have seen nothing to dissuade us from this position.
- Iran and Venezuela have forged a 20-year cooperation agreement after Iran violated U.S. sanctions by delivering oil to Caracas.
- Israel and Iran have been engaging in unconventional attacks for some time. There is growing evidence that Iraqi Kurdistan is becoming the field of battle. Iran also believes Israel poisoned two of its scientists, killing both.
- After weeks of discussion, President Biden will visit the KSA and Israel next month. The administration hopes to encourage the KSA to increase oil production.
- Iraq’s largest political bloc resigned after it was unable to form a government. The concern is that Iranian-aligned groups will take power.
- Political conditions in Libya continue to deteriorate, leading to a near cessation of production. Simply put, Libyan output is estimated to be down 1.0 mbpd. This loss would more than offset OPEC+ promised production hike.
- Algeria has suspended cooperation with Spain after the latter supported Morocco’s plan for Western Sahara[1]. Spain has influence over the disputed territory of Western Sahara, but Morocco controls 80% of the territory. Unfortunately for Spain, it is dependent on Algeria for its natural gas supplies. So far, Algeria hasn’t signaled that it would cut off supplies, but given the gas has been sold under long-term contracts at lower than market prices, we could see this dispute used to reset those prices.
- As the EU and the U.S. have either cut off or reduced oil purchases from Russia, Moscow has been forced to redirect sales to other areas. India has been quietly lifting purchases, enjoying deep price discounts. India is now importing up to 1.0 mbpd compared with sporadic imports before the Russian invasion. Although Washington opposes these imports, the U.S. has generally overlooked the purchases in order to maintain good relations with India. However, it appears “enough is enough.” The U.S. is asking India to “cool it” on the purchases. If India fails to comply, the U.S. might implement secondary sanctions.
- India has also raised the ire of the GCC over anti-Islamic comments from Bharatiya Janata Party (BJP) officials. The BJP is a Hindu party and has been accused of suppressing Muslims.
- Despite sanctions and price discounts, Russia’s oil revenue continues to rise.
Alternative energy/policy news:
- Although EVs hold great promise to reduce CO2 emissions, it should be recognized that producing these batteries is far from a clean process.
- The IMF is arguing that a realistic carbon tax is more effective in reducing the impact of greenhouse gases than accelerating clean energy.
- The U.S. is moving to standardize charging stations to make them universally compatible.
- As natural gas prices soar, interest in biomass has returned.
- As global grain supplies tighten, the debate over the best use of crops has returned. Specifically, the debate asks the question “should we use grains for fuel?”
- The Pentagon is partly funding a rare earths processing plant in Texas.