

Daily Comment (October 4, 2018)
by Bill O’Grady and Thomas Wash
[Posted: 9:30 AM EDT] It’s a global down day for equities. Rising long-duration interest rates are the most cited culprit. Here is what we are watching today:
Rising long-duration yields: Long-duration yields are mostly a function of the policy rate and inflation expectations. Determining the policy rate is a snap. Determining inflation expectations is another matter. History tends to show that inflation expectations change slowly, although some factors, like oil, can cause short-term shifts in anticipated inflation.
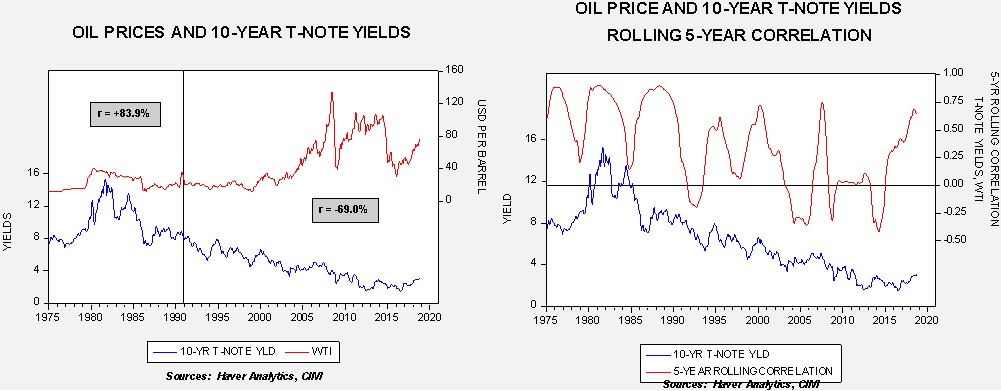
The chart on the left shows oil prices and 10-year yields. From the mid-1970s into 1990, the two series were positively correlated at the level of +83.9%. Since then, the two series are negatively correlated at the level of -69.0%. During the 1980s into the 1990s, anyone building a yield model incorporated oil prices because yields were very sensitive to oil prices. However, as investors began to believe that the central banks would prevent oil prices from triggering wider inflation, the correlation flipped. Simply put, until the early 1990s, investors believed that high oil prices lifted inflation. After the early 1990s, investors believed that high oil prices depressed economic activity and thus was bullish for Treasury prices (leading to lower yields).
However, the chart on the right shows that there are short periods when there is a positive correlation between oil prices and yields. We use a five-year rolling correlation which shows that even in the post-1990 period, when the general correlation was lower, there are episodes when the correlation turns positive for short periods of time. It would seem that these phases tend to occur when economic growth is strong, such as the one we are in now. Thus, part of the rout we are seeing in the long end is due to high oil prices, which, as we note below, are mostly due to fears of Iranian sanctions.
At the same time, there are growing worries about the policy rate. Recent speeches by Chair Powell and other FOMC members mostly lean hawkish.[1] Although the Phillips Curve seems to be rapidly falling out of favor (as it probably should), we are entering a period where there is no dominant model for inflation and its effect on policy. Instead, we are increasingly left with anecdotes. For example, here is one from Chair Powell’s recent speech which measures reported bottlenecks or shortages in the Beige Book.
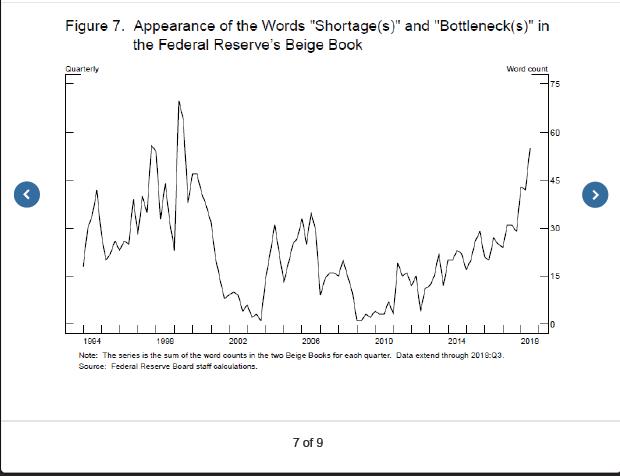
Pretty scary, huh kids?[2] Well, in the 1998 period, when bottlenecks were being widely reported, core CPI topped out at 2.5%. In 2001, when reported bottlenecks nearly disappeared, core CPI peaked at 2.8%. Simply put, reported bottlenecks seem to have little relationship to actual inflation.
So, what’s driving bond yields higher? Fears of continued policy tightening and oil prices. The two-year deferred Eurodollar futures have ticked up to an implied yield of 3.27%, suggesting a terminal fed funds target of at least 3.25%. And, oil prices are raising short-term inflation worries. But, the recent move is excessive and smacks of short-covering and we suspect it won’t be maintained.
China: The news flow on China overnight was quite negative. First. Bloomberg broke an important story alleging that Chinese spies used a hardware hack to essentially use our smart phones to monitor our behavior.[3] The U.S. Navy is proposing a major show of force in the South China Sea.[4] VP Pence is said to be preparing a speech outlining Chinese aggression.[5] Overall, relations are looking increasingly strained. The breakdown in relations will tend to pressure Chinese financial assets with residual effects on other EM markets.
Energy recap: U.S. crude oil inventories rose 8.0 mb compared to market expectations of a 1.5 mb draw.
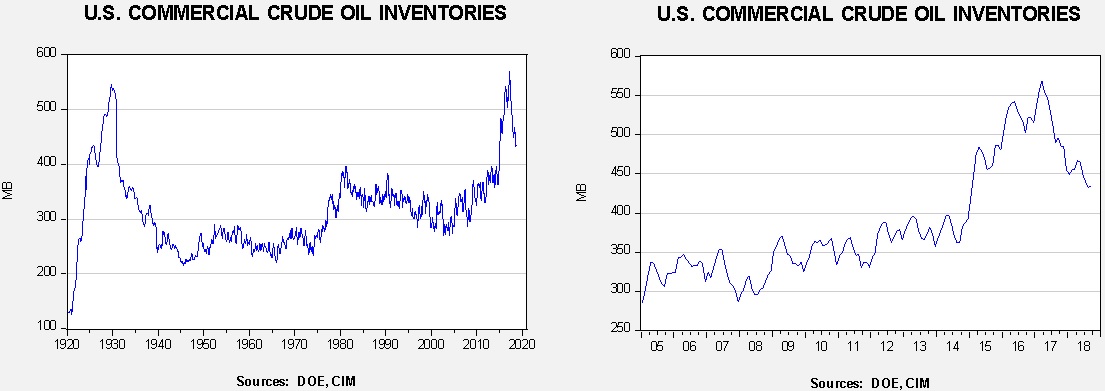
This chart shows current crude oil inventories, both over the long term and the last decade. We have added the estimated level of lease stocks to maintain the consistency of the data. As the chart shows, inventories remain historically high but have declined significantly since March 2017. We would consider the overhang closed if stocks fall under 400 mb. Refinery utilization was unchanged at 90.4% as was oil production at 11.1 mbpd. Exports declined 0.4 mbpd, while imports rose 0.2 mbpd. The rise in stockpiles was mostly due to falling exports and slower refining activity.
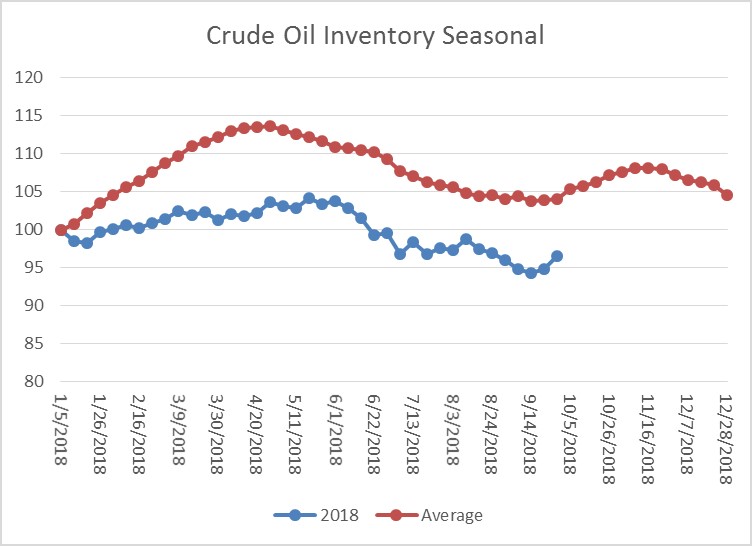
As the seasonal chart below shows, inventories have begun their seasonal build period. We should see inventories continue to rise in the coming weeks as refinery operations decline for autumn maintenance.
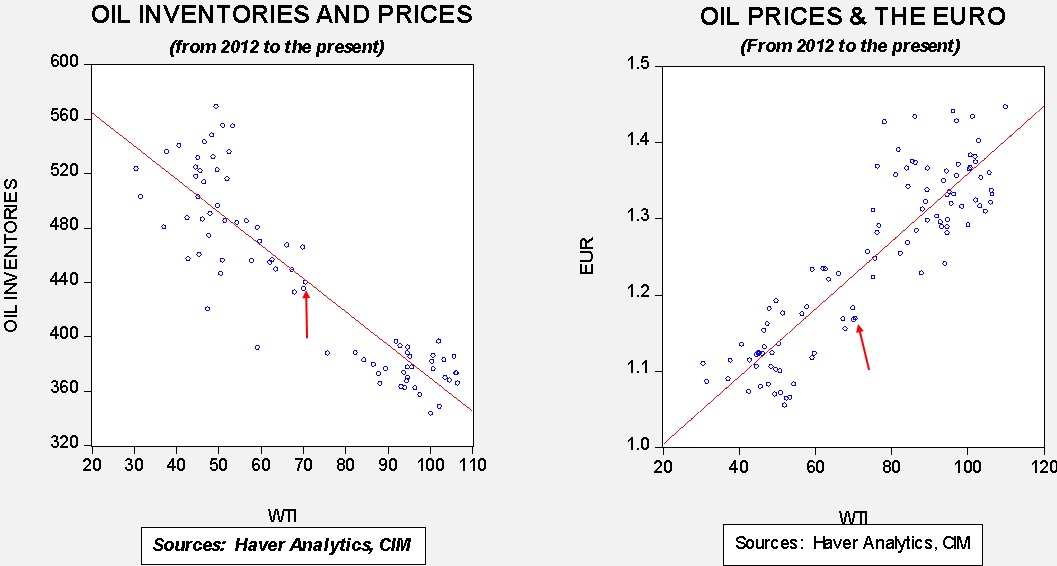
Based on inventories alone, oil prices are below fair value price at $70.20. Meanwhile, the EUR/WTI model generates a fair value of $60.88. Together (which is a more sound methodology), fair value is $64.77, meaning that current prices are well above fair value. Oil prices have been in a strong bull market for the past several weeks, mostly on fears of supply constraints from sanctions on Iranian oil exports. In fact, Russian President Putin suggested to President Trump today that he should stop blaming OPEC and foreign oil suppliers for high oil prices and instead “look in the mirror.”[6] Although this week’s data is bearish for oil prices, news that the U.S. was pulling out of a 63-year oil treaty with Iran after the Iranians won a verdict at the International Court of Justice boosted prices.[7] Relations with Iran continue to deteriorate and the increase in tensions is supporting higher prices in the face of rising stockpiles.[8] It is possible that, at least in the short run, oil prices are getting a bit ahead of themselves. But, fear of supply losses in the coming weeks is keeping a bid under the price of oil.
[1] https://apnews.com/cf5305d356fd49309543d711ea5ef6e9/Fed-chairman-defends-gradual-pace-of-rate-hikes
[2] https://www.youtube.com/watch?v=t9iIf4tFoyE
[3] https://www.bloomberg.com/news/features/2018-10-04/the-big-hack-how-china-used-a-tiny-chip-to-infiltrate-america-s-top-companies?srnd=businessweek-v2&utm_source=newsletter&utm_medium=email&utm_campaign=newsletter_axiosam&stream=top
[4] https://www.cnn.com/2018/10/03/politics/us-navy-show-of-force-china/index.html?utm_source=newsletter&utm_medium=email&utm_campaign=newsletter_axiosam&stream=top
[5] https://www.nytimes.com/2018/10/03/us/politics/china-pence-trade-military-elections.html?action=click&module=Top%20Stories&pgtype=Homepage
[6] https://www.bloomberg.com/news/articles/2018-10-03/putin-tells-trump-to-blame-guy-in-the-mirror-for-high-oil-prices
[7] https://www.cnn.com/2018/10/03/politics/pompeo-icj-iran-ruling/index.html
[8] https://www.bloomberg.com/news/articles/2018-10-03/iran-oil-buyers-craving-obama-s-waivers-get-trump-shock-instead