

Daily Comment (October 30, 2020)
by Bill O’Grady, Thomas Wash, and Patrick Fearon-Hernandez, CFA
[Posted: 9:30 AM EDT] | PDF
It’s Friday, the last one in October; have a safe Halloween, everyone! Equity markets are back in the red, despite impressive earnings from the large tech firms. China starts our coverage; the plenum session is over, and the next five-year plan is in place. We take a second look at the GDP data from yesterday. The pandemic update is next. We close with a couple of news items from the EU. Being Friday, we have a new Asset Allocation Weekly along with its related podcast and chart book. In this report and episode, Patrick takes you inside the EU to show you where the real power resides. N.B. Starting in January, in a bid to shorten this report, we will no longer publish the AAW at the bottom of the Daily. It will be available only as a standalone report but will be linked within the Daily Comment. Here are the details:
The Five-Year Plan: Marxist states have tended to create five-year plans. Stalin created the first one in 1928. Communist economics is based on central planning. Thus, creating national “marching orders” is a logical path. The latest one is China’s 14th. In one sense, there are no huge surprises in the documents. China is facing technological restrictions from the U.S. so there was much talk about becoming self-reliant in this sector. Although relations with the U.S. are not discussed overtly, opposition to the U.S. runs through the report. The press release lacked detail, but that was expected. The full report won’t be out until March. The report did say China wants to be a “moderately-developed country” by 2035. Although we tend to look at China as an economic powerhouse, in per capita terms, it’s a lightweight. In terms of nominal GDP, using IMF data, China ranks 59, between Chile and Malaysia. On a purchasing power parity basis, again using IMF data, it ranks 73, surrounded by Guyana and Turkmenistan. Using this measure, China’s GDP per capita is 27.3% of America’s. To reach the level of Portugal by 2035, at 52.6% of U.S. per capita GDP, Capital Economics estimates China will need to grow 7.3% per year. That’s a stretch. It could be especially difficult if China is turning inward.
The other interesting item to note is that in the title, 2035 is predominant and tied to Xi. Perhaps this is a sign of how long he intends to remain in office. It is not that we didn’t know that Xi was planning to stay in power. But, this document is official evidence of that decision.
In other news from China:
- The U.S. has officially assured China that it has no plans to launch an attack on Chinese-held islands in the South China Sea. Although we haven’t seen anything on this issue, it was apparently a rumor in China. According to reports, SoD Esper assured Chinese leaders that no such attack was being planned. We have observed that military-to-military contacts between the U.S. and China have remained open and are sometimes used as a back channel when tensions are elevated.
- Navy Secretary Braithwaite has been quoted as saying, “China poses a greater threat to the U.S. than many Americans may realize.” For those in the foreign policy establishment, this lack of realization is a huge problem. The Soviets were a clear foil with a much different economic system. China’s political system is very different than the U.S., but the economic systems are not all that different. In addition, economic ties between the U.S. and U.S.S.R. were few; that is not the case between the U.S. and China. Thus, using the Cold War model may not be the best way to address the China threat, because it may be impossible to create a narrative that is believable to most Americans. We discussed this issue in a recent Weekly Geopolitical Report.
- It isn’t just U.S. firms that complain about government regulation; Chinese firms are grumbling about new environmental regulations that are reducing supplies of rare earths.
About GDP: A couple of charts about the latest GDP report. First, in a recent AAW, we discussed the impact of the pandemic on the underlying data in the GDP report. We noted that spending had shifted to goods and away from services. The data released yesterday indicates that this pattern persists.
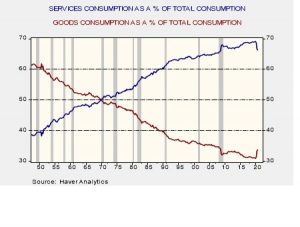
Since Q4 2019, the services share has declined from 69.1% to 66.3%, and the goods share has increased to 33.7% from 30.9%.
Second, although the q/q% rise was the strongest on record, the economy remains well below the cycle peak.
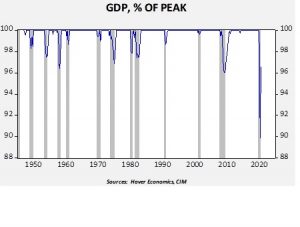
This chart shows the path of real GDP as a percentage of the recent maximum. At the trough in Q2 2020, GDP was 10.1% below the 2019 Q4 peak. We have recovered to 96.5% of the previous peak. In relation to the cycle peak, the economy is now about where it was as the trough in Q2 2009.
Finally, the contribution from government to GDP was negative in Q3 2020. Overall, a drop in government spending subtracted 68 bps from growth. Governments are looking to raise taxes to rebuild unemployment insurance funds, which may act as a further drag on growth.
COVID-19: The number of reported cases is 45,148,200 with 1,182,368 deaths. In the U.S., there are 8,947,980 confirmed cases with 228,677 deaths. For illustration purposes, the FT has created an interactive chart that allows one to compare cases across nations using similar scaling metrics. The FT has also issued an economic tracker that looks across countries with high frequency data on various factors. New cases in the U.S. rose 88,500 yesterday, a new daily high. The Rt data show only two states with readings of <1; a reading >1 suggests rising infection growth. Mississippi is recording the lowest reading, with Wyoming showing the highest.
Virology:
- One of the reasons for lockdowns is to slow infection rates and hospitalizations. Europe is returning to restrictions because hospitals are starting to hit capacity constraints. So far, we are not seeing a similar situation in the U.S., but in the spring, Europe did act as a leading indicator for the U.S. Thus, concerns are elevated and reflected in asset prices.
- Studies indicate that Regeneron has been effective in reducing viral loads. However, the cost of treatment is very high, and there are doubts that production could be scaled up enough to be a widespread treatment for COVID-19.
EU: A couple of news items of note:
- The EU Parliament is continuing to make progress on approving the €750 billion Eurobond.
- We haven’t commented on the Wirecard (WCAGY, USD 0.35) scandal. The FT did a great job in reporting on this event. A new development in the case has emerged. Jan Marsalek, the COO of Wirecard, and currently an international fugitive, was an informant for the Austrian BVT, their spy agency.