

Daily Comment (May 3, 2018)
by Bill O’Grady and Thomas Wash
[Posted: 9:30 AM EDT]
The FOMC: Yesterday, the FOMC decided to maintain interest rates. We currently expect three hikes this year, with the next rate increase coming in June. Although the recent core PCE report shows that inflation is only 10 basis points shy of the FOMC, we are reluctant to revise our forecast from three to four rate hikes because we are not sure about the level of inflation that the Fed is willing to tolerate.
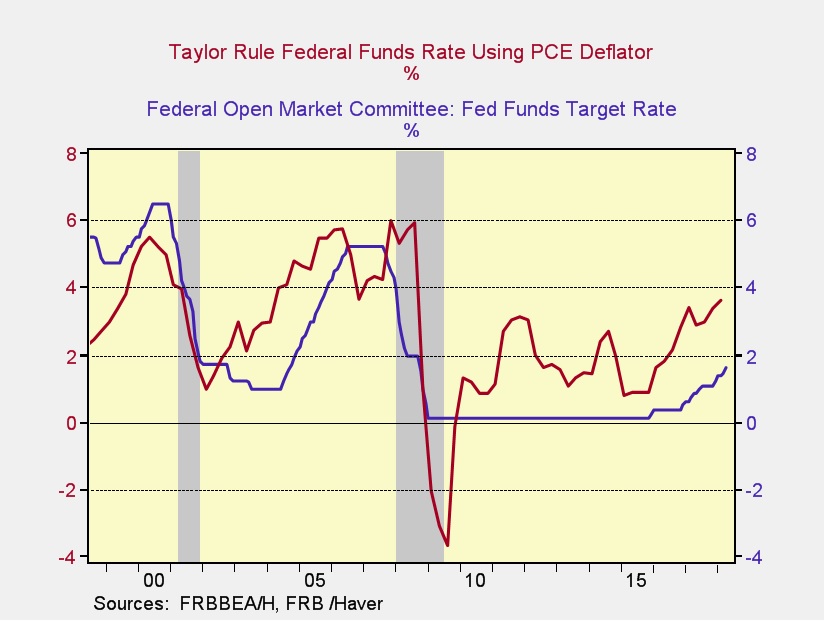
The chart above shows the projected fed funds rate based on the Taylor Rule and the effective fed funds rate. Using the PCE deflator and the projected output gap as control variables, the Taylor Rule projects the effective fed funds rate should be 3.63%. Currently, the effective fed funds rate sits at 1.63%. Although the chart above suggests the Fed has room to raise rates, there have been concerns that a possible rate hike could have adverse effects on the economy. Tight monetary policy generally dampens consumption by making it more expensive for households to borrow.
Energy recap: U.S. crude oil inventories rose 6.3 mb compared to market expectations of a 1.0 mb build.
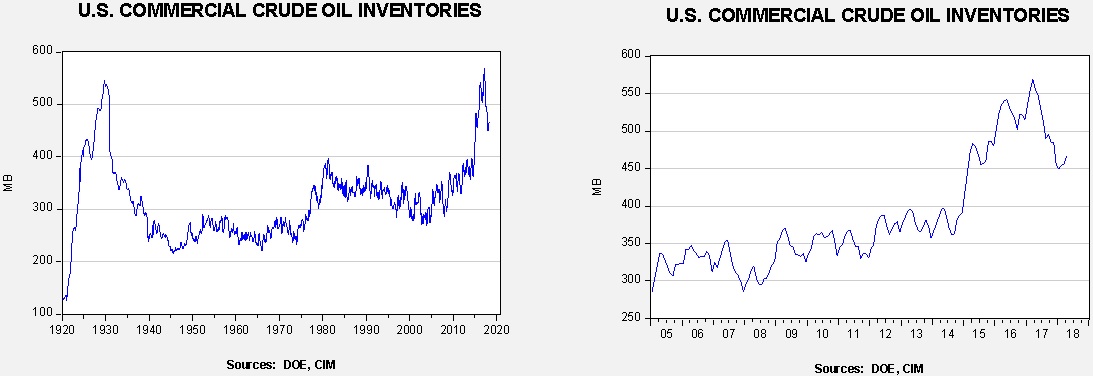
This chart shows current crude oil inventories, both over the long term and the last decade. We have added the estimated level of lease stocks to maintain the consistency of the data. As the chart shows, inventories remain historically high but have declined significantly since last March. We would consider the overhang closed if stocks fall under 400 mb.
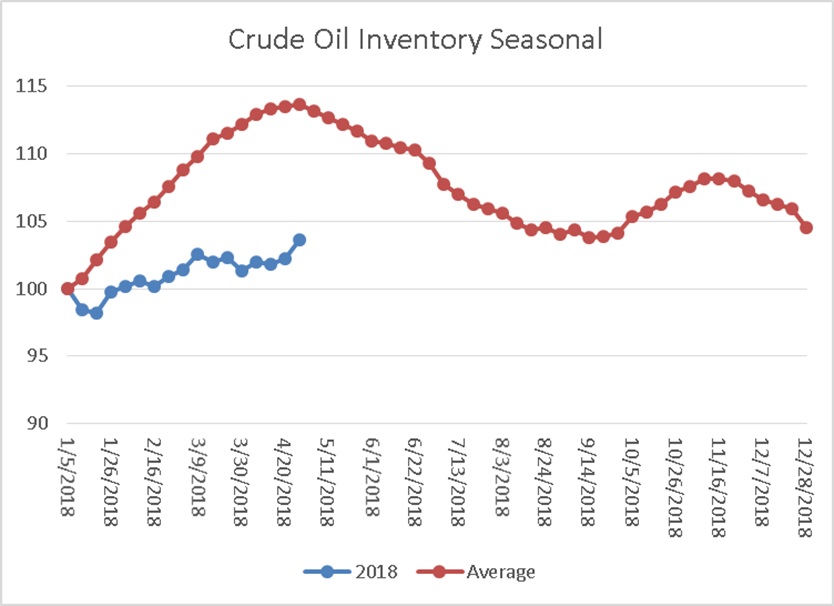
As the seasonal chart below shows, inventories are usually rising this time of year. This week’s rise in stockpiles is normal. We note that next week’s report is usually the seasonal peak in inventories. If we follow the normal seasonal draw in stockpiles, crude oil inventories will decline to approximately 427.4 mb by September.
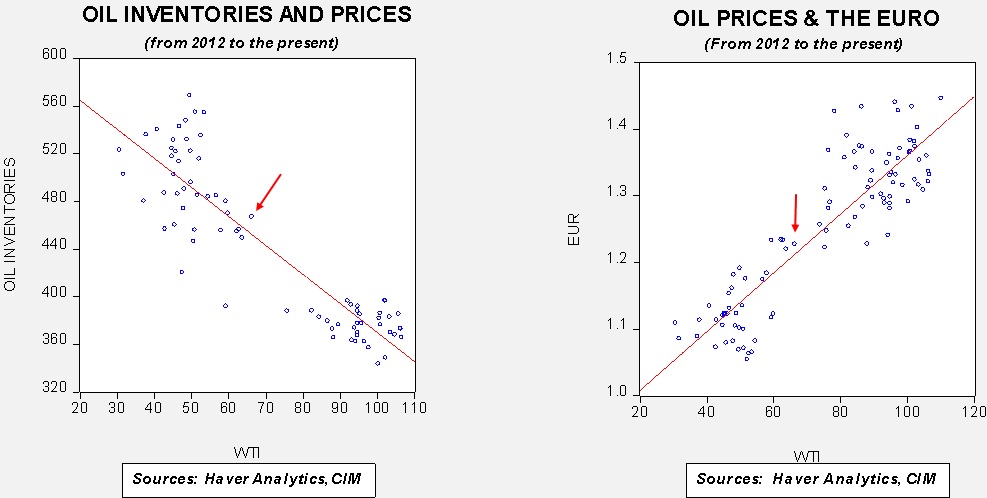
Based on inventories alone, oil prices are undervalued with the fair value price of $62.28. Meanwhile, the EUR/WTI model generates a fair value of $73.44. Together (which is a more sound methodology), fair value is $69.68 meaning that current prices are below fair value. Using the oil inventory scatterplot, a 427 reading on oil inventories would generate oil prices in the high $70s to low $80s range. At present, we have no reason to believe that inventories won’t follow their usual path so, barring an increase in supply or a sharp rise in the dollar, the case for higher oil prices is improving.