

Daily Comment (May 12, 2017)
by Bill O’Grady, Kaisa Stucke, and Thomas Wash
[Posted: 9:30 AM EDT] Although the Comey situation continues to dominate the news flow, we are reaching the point where there isn’t really anything new. So far, the financial markets are managing the situation calmly.
The U.S. and China announced a trade agreement. On its surface, it doesn’t look like it will affect the overall trade deficit but it will boost two key constituents for the president—energy and agriculture. The ban on beef exports will be lifted; the Chinese had implemented a partial ban after the “mad cow” scare 14 years ago. It appears that the beef market has probably anticipated this action.
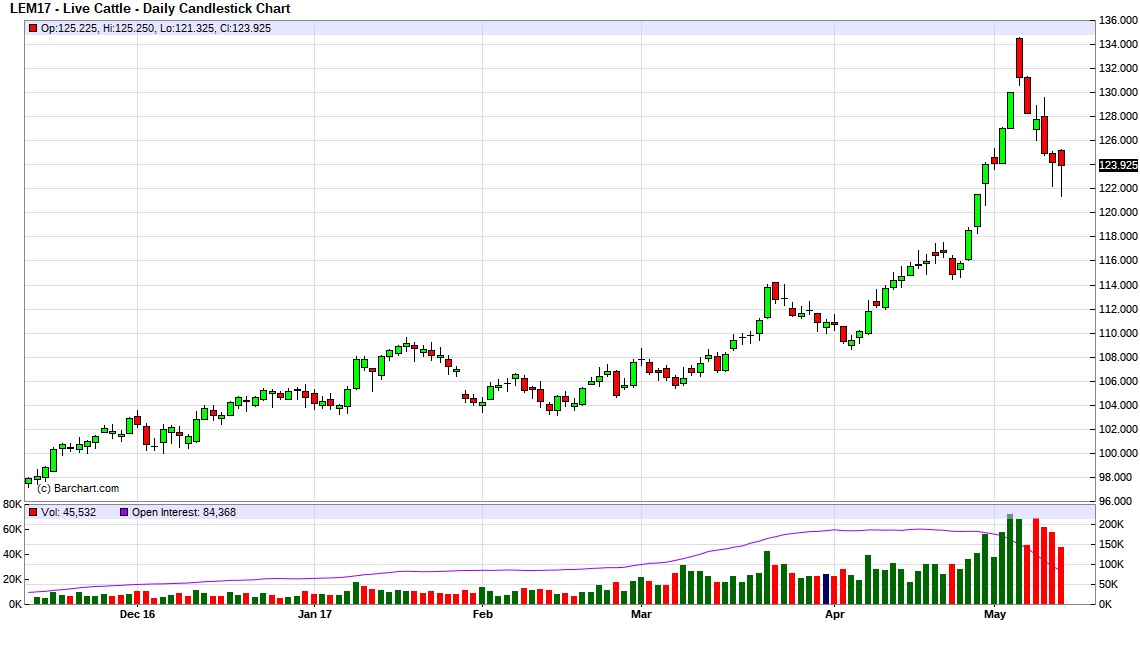
Prices jumped but have fallen off their highs. In addition, the U.S. will be able to export LNG to China, although it isn’t obvious that this change will result in any major exports immediately. China already has sources in Asia and the U.S. is still building the infrastructure for gas liquefaction. One item left out was any language about the U.S. allowing Chinese firms to invest in the natural gas industry. The U.S. also said it “recognizes the importance of the [one belt, one road] initiative.” Negotiating a deal, even a modest one, shows that the administration can move forward on policy even amidst controversy.
China has been steadily tightening monetary policy and it’s starting to show up in the term structure. The five-year/10-year yield curve has inverted, although we are not sure this really matters. However, we are seeing a rapid narrowing of the one-year/10-year yield curve, which is probably more significant because it highlights the impact of policy tightening.
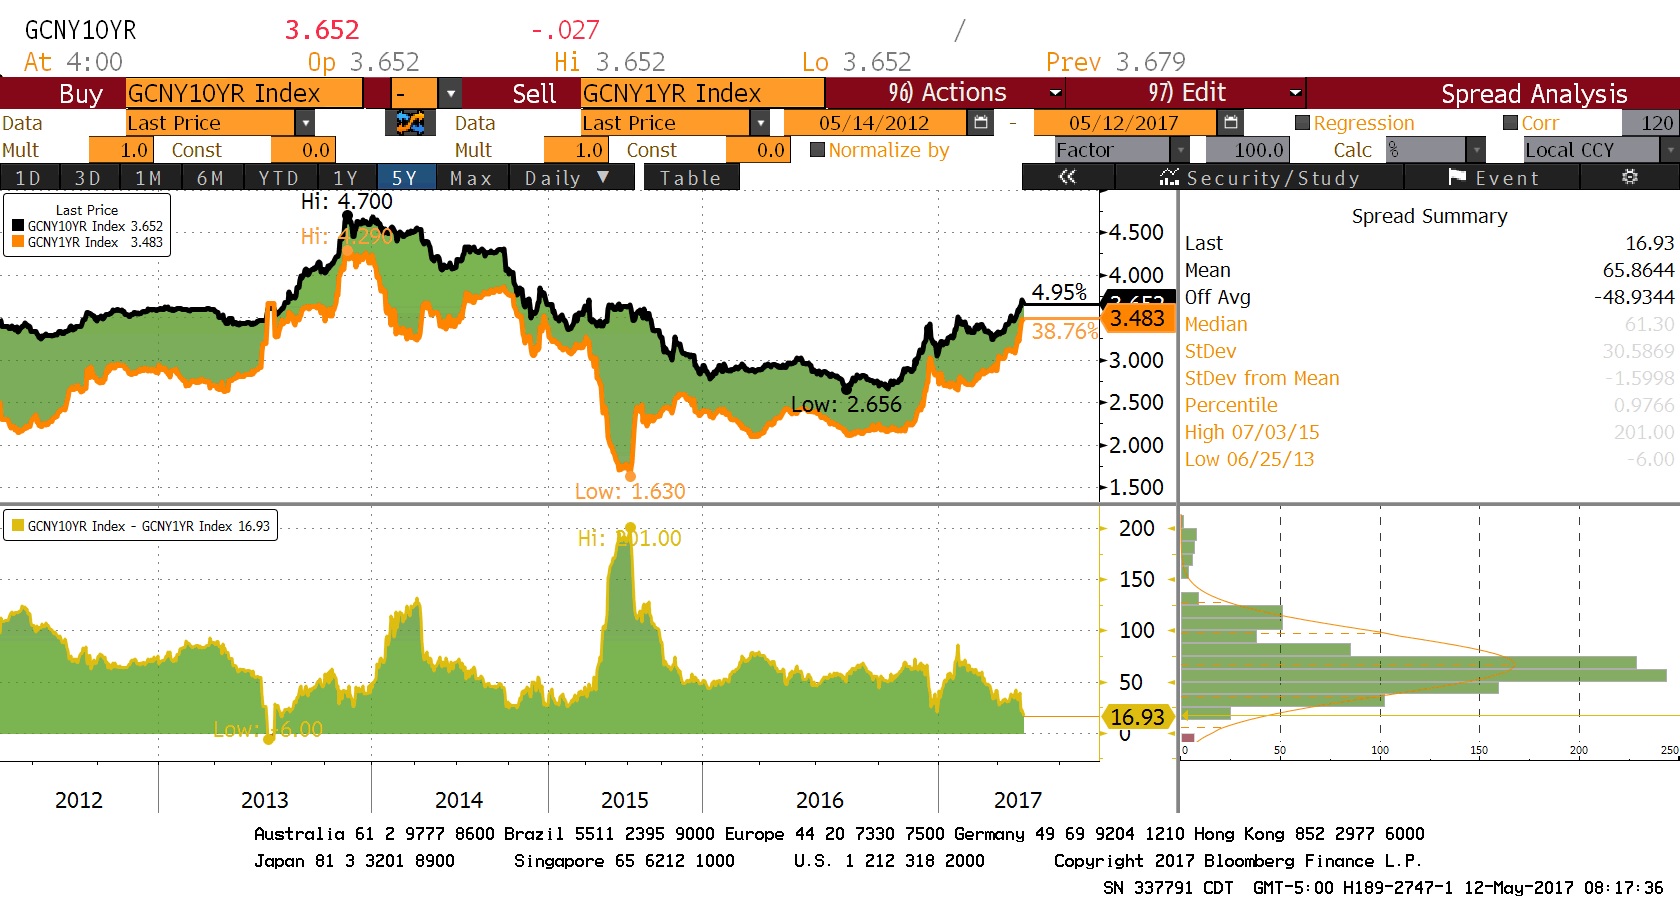
We have seen this curve invert before, in mid-2013, driven by a spike in the one-year rate. However, the rise in the short rate was brief. As the lower line on the chart shows, the curve in China is flattening. In most economies, an inverted yield curve is a clear signal of future economic contraction. As the chart shows, policymakers in China tend to back away from policy tightening once the curve moves to flatten; we wouldn’t be surprised to see similar behavior this time, either. But, if the PBOC continues to ratchet rates higher, we will soon be approaching a level of concern.
Reuters is reporting that the administration is “weeks” away from appointing new governors to the FOMC. Currently, there are three governor openings. Appointing governors to the FOMC is perhaps the second most important appointment a president gets to make, overshadowed only by the Supreme Court. Who gets these jobs will have an important impact on monetary policy. The Bannon wing will likely want to appoint dovish governors, while the Cohn wing would lean toward hard money types. Media speculation has trended toward hawks. Since appointments are weeks away, the earliest any of these seats could be filled is autumn. We do also expect both Yellen and Fischer to exit in Q1 2018, so President Trump will get to appoint up to five of the seven governors in his term.
With the release of the CPI data, we can upgrade the Mankiw models. The dip in the core CPI rate (see below) did affect the Mankiw Rule model results. The Mankiw rule models attempt to determine the neutral rate for fed funds, which is a rate that is neither accommodative nor stimulative. Mankiw’s model is a variation of the Taylor Rule. The latter measures the neutral rate using core CPI and the difference between GDP and potential GDP, which is an estimate of slack in the economy. Potential GDP cannot be directly observed, only estimated. To overcome this problem with potential GDP, Mankiw used the unemployment rate as a proxy for economic slack. We have created four versions of the rule, one that follows the original construction by using the unemployment rate as a measure of slack, a second that uses the employment/population ratio, a third using involuntary part-time workers as a percentage of the total labor force and a fourth using yearly wage growth for non-supervisory workers.
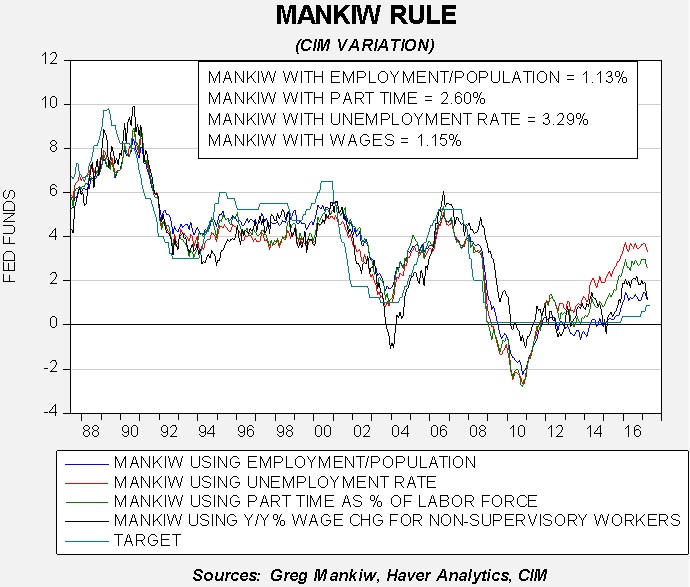
Using the unemployment rate, the neutral rate is now 3.29%. Using the employment/population ratio, the neutral rate is 1.13%. Using involuntary part-time employment, the neutral rate is 2.60%. Using wage growth for non-supervisory workers, the neutral rate is 1.15%. Although the labor market data for April improved, the fall in the core CPI rate offset most of those gains, leading to lower projected rates for all models.
What is notable is that for two of the variations, wage growth and the employment/population ratio, the FOMC is nearly at a neutral rate now. The fact that policymakers appear driven to lift rates further suggests they are more concerned with either involuntary part-time employment or the unemployment rate.
Since the Great Financial Crisis, it has been unclear which measure of employment accurately characterizes the labor market. Because the Fed was conducting very easy monetary policy, the debate was mostly academic; that isn’t the case anymore. If the accurate measure is the employment/population ratio or wage growth but the Fed thinks either the unemployment rate or involuntary part-time employment is the correct indicator of slack, policymakers would run the risk of overtightening and risking a recession.
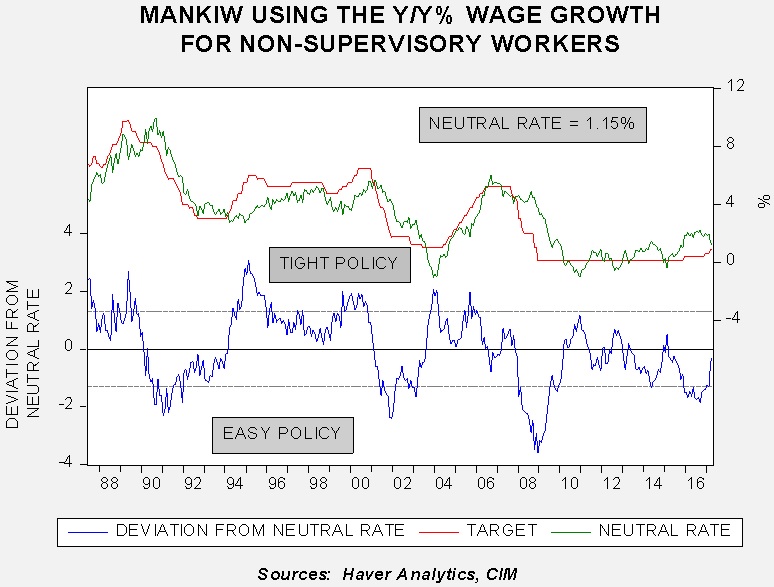
This chart shows the issue; this is the Mankiw model variation using wage growth. The lower line on the chart shows the deviation from the neutral rate as projected by the model. When the rate is below zero, policy is leaning toward accommodative. Note the parallel lines on the lower part of the chart; these lines measure a standard error on either side of the neutral rate. When the deviation is within the parallel lines, it suggests policy is mostly neutral. Thus, based on wage growth, we are close enough to neutral policy that the Fed could stand pat until either wage growth accelerates or core CPI rises.
Thus, the coming months will be key. If this model is the most accurate measure of slack then the Fed needs, at most, one more hike. Policy would be tight at a fed funds target of 2.40%, so there is some element of tolerance that the economy should be able to manage. Based on the dots chart, we would be at this level by the end of next year. Simply put, we could be approaching a period where monetary policy shifts to a headwind.