

Daily Comment (March 21, 2019)
by Bill O’Grady and Thomas Wash
[Posted: 9:30 AM EDT] Bond yields continue to decline while equities come under pressure. Here is what we are watching this morning:
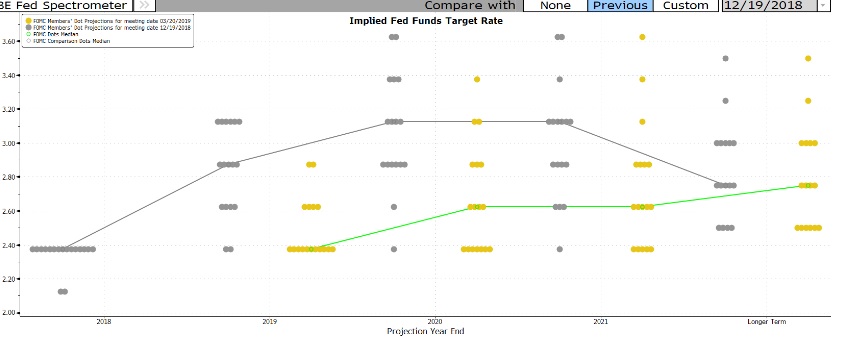
The FOMC: A dovish outcome was expected and the Fed delivered. First, the dots plot was lowered, projecting no rate changes this year and only one more rate increase next year. On the chart below, December is in gray and March is in yellow with a green line.
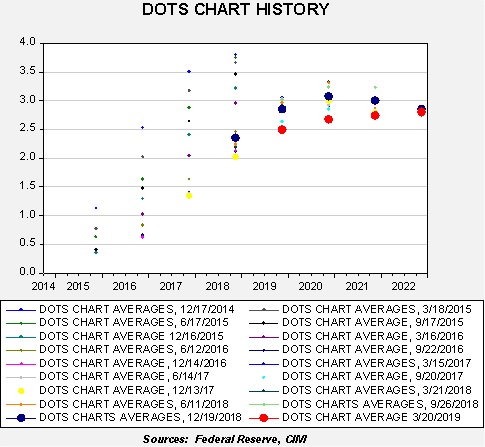
Here is another way of looking at the evolution of the dots. On the chart below, the December meeting is shown as large dark blue dots and yesterday’s meeting is in red. Note the significant decline in projections. The history of the dots makes very clear that the FOMC thought a normal recovery would develop and support a return to “normal” fed funds levels. Continued low inflation has prevented the FOMC from moving the target rate higher.
Second, in the statement, the FOMC acknowledged the slowdown in growth and low inflation. The economic expectation data showed that the committee is forecasting GDP less than 2% for the foreseeable future with controlled inflation. In general, there is no reason to lift rates.
And third, the Fed will likely end QT in September. Again, we view this change as mostly psychological but, in the bigger scheme of things, reducing the balance sheet was unnecessary. Simply holding it steady would have reduced its impact over time (e.g., its share of GDP would have declined), so QT was, to some extent, a kind of “unforced error.”
Although equities rallied initially, the lift failed to hold as financials suffered. Long-duration bond yields fell and the dollar weakened as well. To a great extent, equity markets had already discounted more dovish policy. However, without a steepening yield curve and dollar weakness, a major lift in stocks will require a pop in earnings.
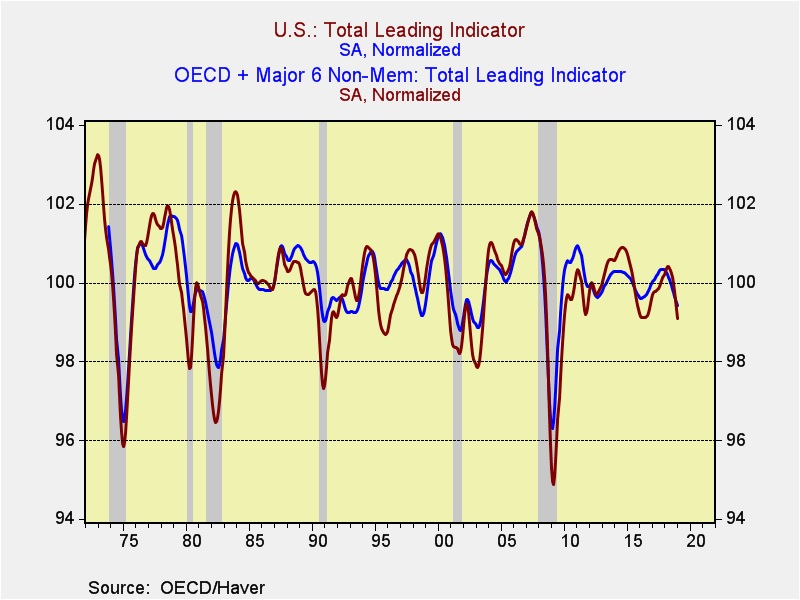
There has been some discussion by financial pundits that the Powell Fed is caving into the financial markets but the move in policy may have more to do with fears of an economic downturn. We note that the OECD’s broad leading indicator and the U.S. leading indicator are showing signs of weakness.
And, comparing the NY FRB yield curve-based recession indicator with the Atlanta FRB GDP recession indicator warns of trouble ahead.
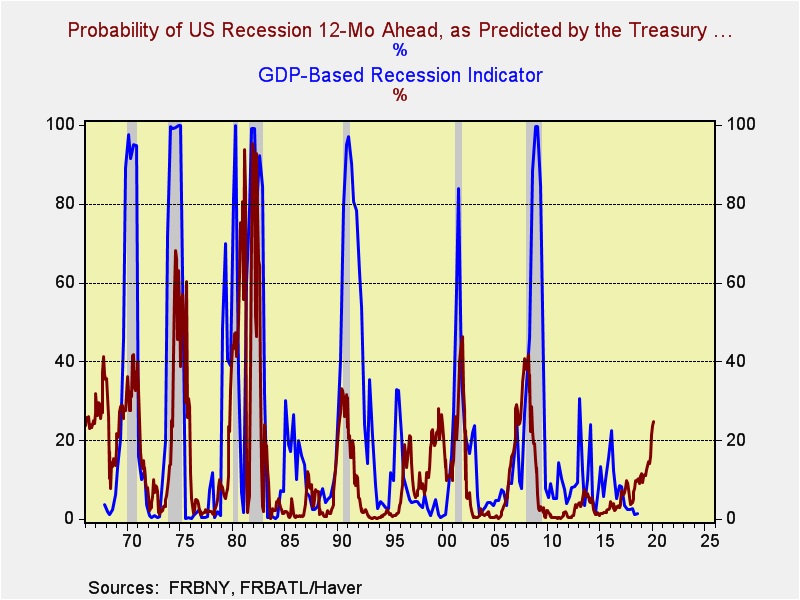
The NY Fed indicator gives us a year lead; any reading above 20 is a cause for concern. The two combined indictors are rather powerful. This tells us that the U.S. needs to steepen the yield curve if the U.S. is going to avoid a recession. And, history shows the normal way to have this occur is for policy to ease. The expectation of one more hike in 2020 from the dots plot suggests the FOMC isn’t quite ready to lower rates.
From our perspective, the continued rally in long-duration Treasuries is a concern. If investors were concerned about inflation, the dovish Fed policy change would have caused higher long-term rates. The fact that long rates are continuing to decline suggests no inflation fear and greater worries about weaker economic growth.
Brexit: We realize this topic is really getting old but the drama is unending. It’s pretty clear there is no consensus in Parliament. PM May’s plan all along was to eliminate other alternatives and have a vote on her deal or a hard Brexit. It appears she will now get her wish. The EU has made it clear that it will grant a short extension to the Article 50 deadline only to give U.K. MPs more time to vote on May’s plan.[1] Otherwise, it’s a long delay or hard Brexit. May is wagering that the hard Brexit supporters will prefer her deal to a long delay.[2] However, there is an element within the Tory Party that would welcome a hard Brexit.[3] Their position seems to be that the expectations of a sudden break are dire but the outcome probably won’t be as bad as expected and thus a hard Brexit would end up being ok.[4] In addition, the hard Brexit supporters have tended to believe the EU will blink. Then again, it appears to us that the EU is better prepared and has more to benefit from a hard break than the British supporters realize. The hard Brexit supporters also believe that the U.K. can quickly make free trade deals with other nations, including the U.S. They will likely be shocked at how hard a bargain the U.S. will drive; we doubt U.S. negotiators would tolerate any restrictions on American agriculture, for example.
We still think the odds favor some outcome that avoids a sudden break. But, it is also clear that this outcome won’t occur until the last minute and the odds of stumbling into a crisis are rising.
Auto tariffs: The Commerce Department has submitted its report to the president on auto tariffs; this triggered a 90-day review period where the president can decide if he wants to implement them. So far, the White House has refused to distribute the findings despite requests from Congress.[5] The concept of auto tariffs are generally panned among his advisors, with the exception of Peter Navarro. The problem is that the auto industry is deeply globalized; tariffs by the U.S. will invite retaliation and could very well paralyze the industry and lead to a sharp downturn in industrial activity. The auto tariffs are especially critical to EU/U.S. trade talks.[6] Although we still expect the administration to make a short-term deal with China and avoid a significant disruption, the EU talks could become the next trade-related disruptive event.
Energy update: Crude oil inventories fell 9.6 mb last week compared to the forecast rise of 2.0 mb.
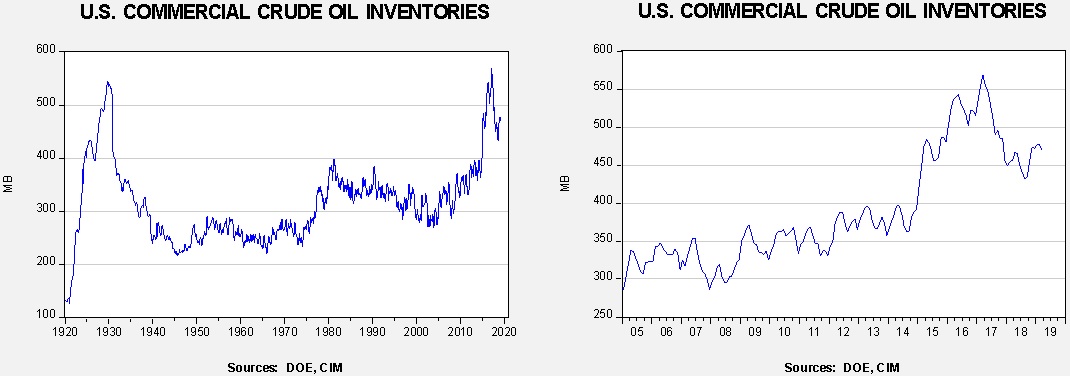
In the details, refining activity rose 1.3% as winter maintenance steadily ends. Estimated U.S. production rose 0.1 mbpd to 12.1 mbpd. Crude oil imports rose 0.2 mbpd, while exports rose 0.9 mbpd.
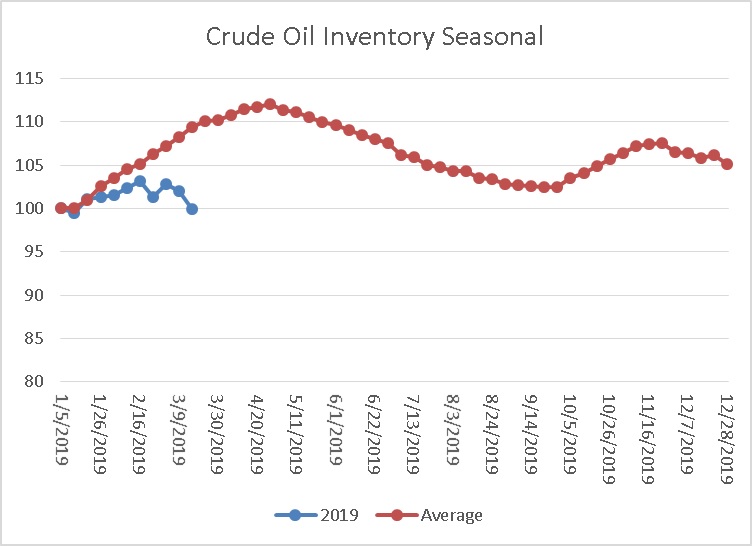
This is the seasonal pattern chart for commercial crude oil inventories. We would expect to see a steady increase in inventory levels that will peak in early May; the pattern coincides with refinery maintenance. The continued decline puts the market further behind the storage injection curve and is bullish.
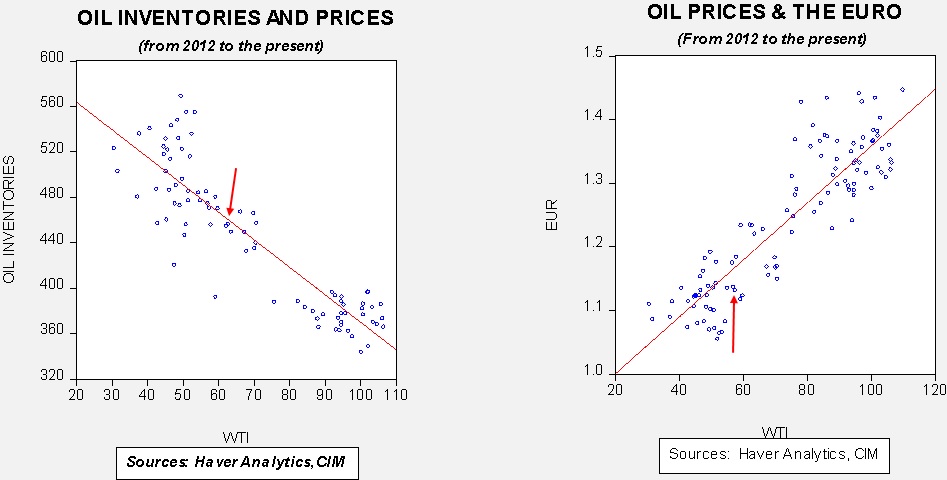
Based on oil inventories alone, fair value for crude oil is $60.78. Based on the EUR, fair value is $53.37. Using both independent variables, a more complete way of looking at the data, fair value is $55.25. We are seeing widening fair value readings on the two individual models, with oil stocks very supportive for prices while the dollar is not. The Fed news could weaken the dollar which could lift oil prices as well. Although we may see a push over $60 in the near term, a sustained rally will probably need some dollar weakness to maintain the rise.
[1] https://www.ft.com/content/971250a4-4ae0-11e9-8b7f-d49067e0f50d?emailId=5c931623bcd2b90004d98730&segmentId=22011ee7-896a-8c4c-22a0-7603348b7f22 and https://www.nytimes.com/2019/03/20/world/europe/theresa-may-brexit-european-union.html?emc=edit_mbe_20190321&nl=morning-briefing-europe&nlid=567726720190321&te=1
[2] https://www.reuters.com/article/us-britain-eu-deal/may-has-a-good-shot-of-getting-brexit-deal-approved-next-week-uk-junior-minister-idUSKCN1R20OF
[3] https://www.ft.com/content/3d6f76da-4b1c-11e9-8b7f-d49067e0f50d?emailId=5c931623bcd2b90004d98730&segmentId=22011ee7-896a-8c4c-22a0-7603348b7f22
[4] https://www.ft.com/content/1376ce46-4b2b-11e9-8b7f-d49067e0f50d?emailId=5c931623bcd2b90004d98730&segmentId=22011ee7-896a-8c4c-22a0-7603348b7f22
[5] https://www.politico.com/story/2019/03/20/trump-tariffs-automobiles-commerce-1228344
[6] https://www.cnn.com/2019/03/20/politics/eu-talks-trump-tariffs/index.html