

Daily Comment (March 2, 2017)
by Bill O’Grady, Kaisa Stucke, and Thomas Wash
[Posted: 9:30 AM EST] Yesterday’s equity market rally was quite impressive; President Trump’s speech was clearly well received and the ISM data also came in strong, raising hopes of a better economy.

This chart shows the yearly change in the S&P 500 index along with the ISM manufacturing index. Over the long run, the two series are modestly correlated. However, since 1997, the two series have been a much closer fit, correlating at 71%.
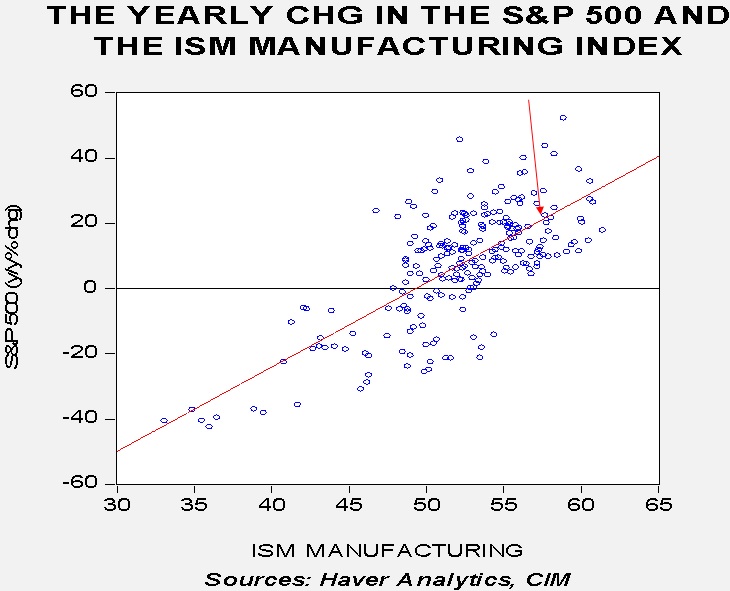
This scatterplot shows the relationship between the two series from 1997 to date. In general, a reading under 50 on the ISM increases the likelihood of a negative yearly return on the index. The current level, at 57.1, is consistent with 22% annual growth in the index. Although the ISM is something of a sentiment index, it does track the economy well and signals that economic growth may be accelerating and the FOMC is probably on the way to raising rates sooner rather than later.
At the end of this report, we have updated our P/E chart and we note that the ratio has jumped. The history of the data comes from Standard and Poor’s but forecast earnings come from I/B/E/S (see the footnote for details), which is owned by Thomson/Reuters. We have noted for some time that the two series have diverged; last year, Q4 earnings from the former were $106.60 (Q4 is estimated by Haver until the official number is released), while the latter is on pace for $118.95. Although the spread over $12 per share is meaningful, we are actually seeing the difference narrow over time.
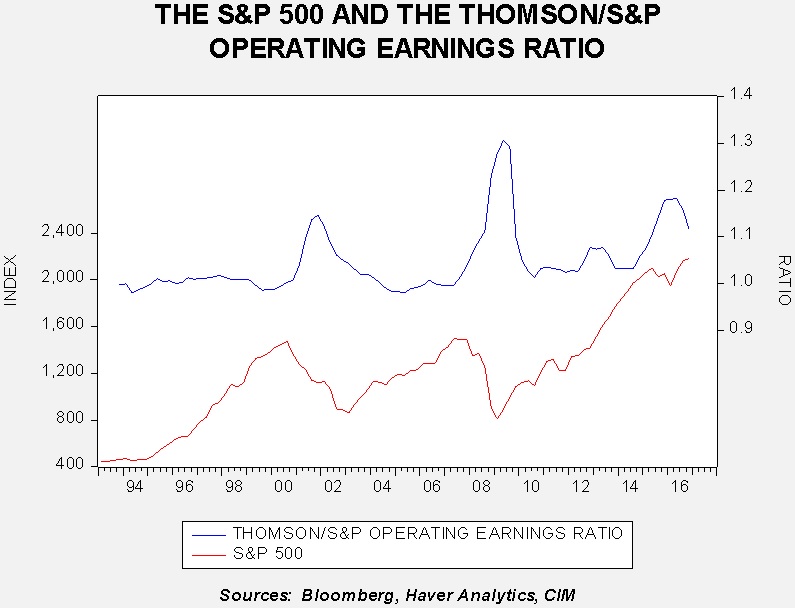
This chart shows the ratio of the two series along with the S&P 500. The ratio has narrowed to 11.5% and is coming down from previous highs but is still elevated. We monitor this ratio closely because in the past a widening ratio tended to coincide with recession and a weaker equity market. We have noted that the spread also seems to track oil fairly well and thus rising oil prices have probably played a role in bringing down the ratio. However, since we have shifted to the Standard & Poor’s estimate for Q4, earnings have fallen and the P/E has increased.
U.S. crude oil inventories rose 1.5 mb compared to market expectations of a 3.0 mb build.
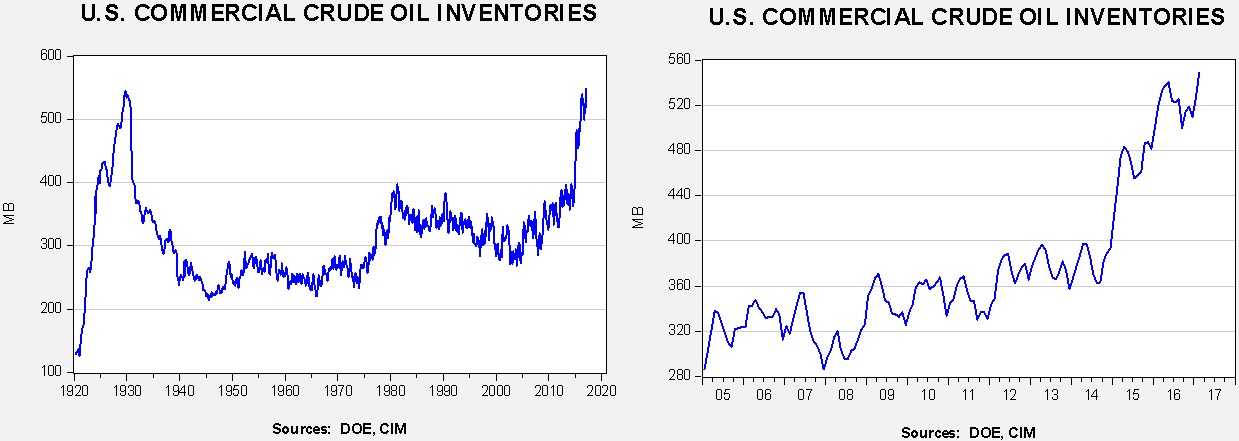
This chart shows current crude oil inventories, both over the long term and the last decade. We have added the estimated level of lease stocks to maintain the consistency of the data. As the chart below shows, inventories remain elevated.
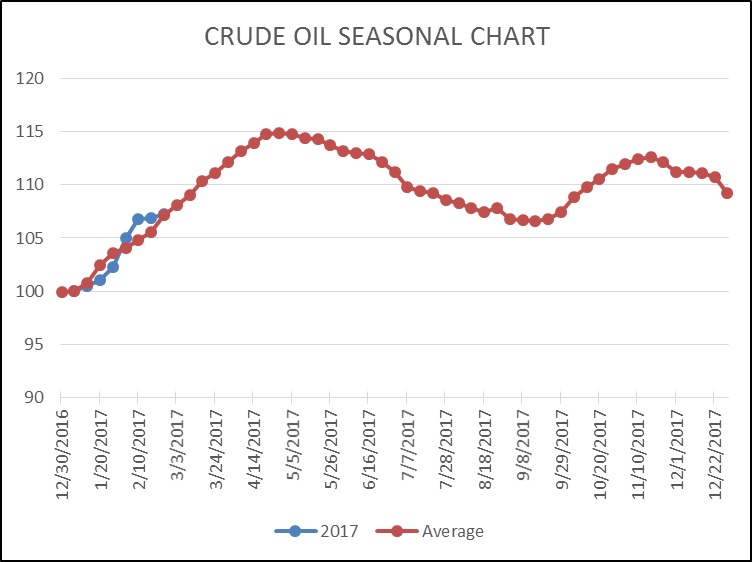
As the seasonal chart below shows, inventories usually increase into April before rising refinery operations for the summer driving season lower stockpiles. After rising quickly earlier in February, the pace of injections has slowed back to normal. If the past two weeks are a guide, we may be on a path to more supportive storage data in the coming weeks. Still, we are looking at six more weeks of injections.
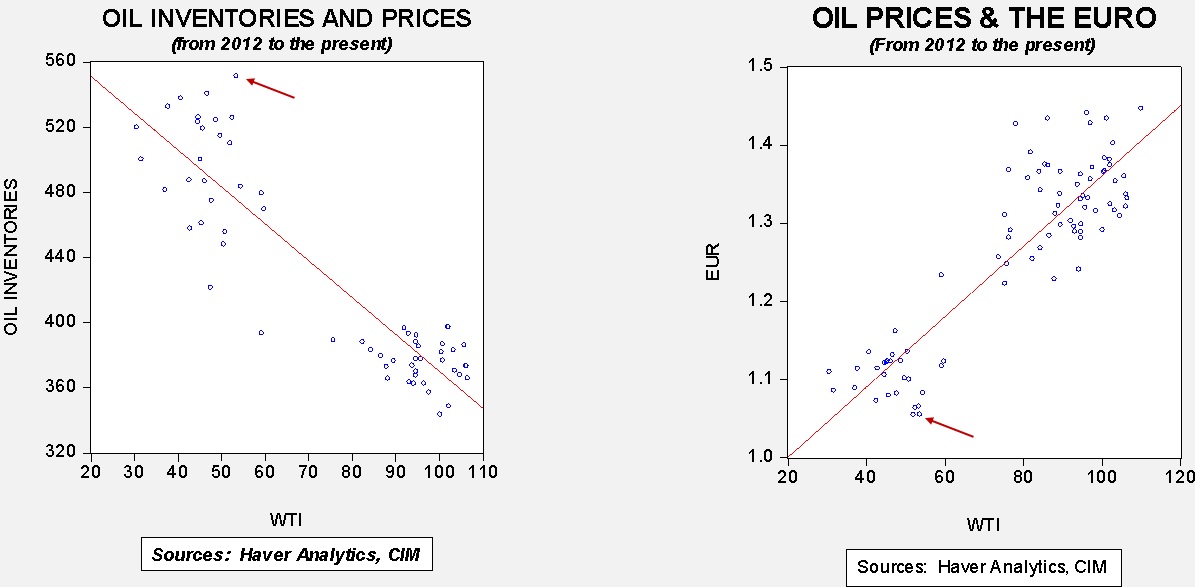
Based on inventories alone, oil prices are overvalued with the fair value price of $30.20. Meanwhile, the EUR/WTI model generates a fair value of $37.91. Together (which is a more sound methodology), fair value is $34.82, meaning that current prices are well above fair value. So far, the oil markets continue to ignore the bearish rise in oil inventories and the stronger dollar. The market has already discounted a drop in stockpiles during Q2; assuming a €1.06, inventories of 380 mb translate into oil prices of $53.36. Without a rapid decline in inventories in Q2, oil prices are vulnerable to a sizeable correction.
Bloomberg is reporting that the early estimates of Russian output show little change in February. Meanwhile, OPEC compliance has dropped to 70% from 80% in January despite another 65 kbpd cut from Saudi Arabia. Most of the drop in compliance came from Libya and Nigeria, which were not assigned quotas; their output combined rose 100 kbpd. Although OPEC compliance remains elevated, it is likely to weaken as time passes. In general, that is the historical pattern. Thus, without a sharp boost in demand, it may become difficult for oil prices to hold at current levels.
Fed Governor Brainard indicated in a speech yesterday afternoon that she thinks policy rates are likely to rise. Brainard is arguably the most dovish member of the committee; if she is now prepared to raise rates, we can expect hikes to come. Fed funds futures now signal a 94% chance of a rise in March.
Finally, reflecting rising concerns about the threat from Russia and growing disinterest from the U.S., Sweden has brought back the draft. Compulsory military service ended in 2010; the new law will cover men and women born in 1999 or later. The Swedish military has been unable to encourage enough young Swedes to enter voluntary service (there are complaints about low pay noted in several articles), thus creating the need to bring back conscription. Sweden spends about 1.1% of its GDP on defense, although it does appear that spending is due to rise.