

Daily Comment (June 8, 2020)
by Bill O’Grady, Thomas Wash, and Patrick Fearon-Hernandez, CFA
[Posted: 9:30 AM EDT]
Our newest podcast episode, “The Long-Term Effects of COVID-19,” is available. In this episode, we discuss how the COVID-19 pandemic will likely accelerate the reversal of the equality/efficiency cycle toward equality.
Good morning and happy Monday! Global stocks are mixed; Europe is lower on disappointing German data, while U.S. equity futures are ticking higher. Tropical Depression Cristobal hit Louisiana over the weekend and remnants are expected in St. Louis on Tuesday. The Fed meets this week; we will get forecasts and maybe a dots plot. Brexit fears are rising; we look at the looming trade deadline and other European trade issues. We update on China and touch on its trade data. The U.S. is pulling troops from Germany. OPEC+ has a deal and oil prices are higher. We update COVID-19, focusing on U.S. and global reopening from lockdown. Additionally, we have some Monday charts! Here is the update:
Policy news: The Fed meets this week. There is absolutely no mystery on the policy rate; since the FOMC has made it clear it doesn’t want negative fed funds, there really isn’t more to be done on that front. Instead, we expect the debate to be over yield curve control. This isn’t exactly new for the Fed; during WWII, the central bank fixed rates across the entire yield curve to control Treasury borrowing costs. However, the impact of such control would be significant. For example, the Treasury curve would no longer be a forecasting tool; we might be able to use the corporate curve, but even there, one would expect some relationship to the risk-free rate. The other issue we will be watching for are forecasts for the economy and the policy rate. The bigger issue here is that if the Fed goes this far, it has essentially ceded its independence. It can get it back at some point, but it will be a war because no president wants to be in office when the Fed stops the stimulus. Harry Truman would concur, we suspect.
Brexit and trade: Although the actual exit date isn’t until year’s end, if the U.K. is going to ask the EU for an extension of Brexit negotiations, it must do so by June 30. By all accounts, PM Johnson has made it clear that he will not ask for an extension, so the odds of a hard break are rising. Trade officials and businesses are beginning to count the costs of a hard border with Europe. A concern has been that British negotiators don’t seem clear on what they want from an agreement with the EU. One of the benefits of a hard break is that the U.K. can make trade deals with other nations; Westminster is looking to make a deal with the U.S. in short order. The U.S. has made it clear that such a deal would include U.S. agriculture, including the infamous “chlorine chickens.” The issue of the U.S. and EU food regulation and trade is nothing new, but could become an issue when the U.S. and U.K. begin trade talks.
China: A sharp decline in imports offset a drop in exports, expanding China’s global trade surplus.
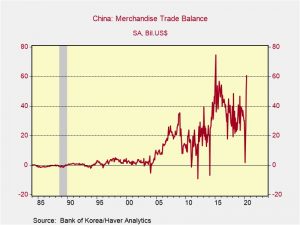
Meanwhile, analysts are questioning China’s employment data, suggesting it is painting too rosy a picture of China’s recovery. Recent policy statements seem to confirm this notion. Lastly, China’s drive to semiconductor self-sufficiency has been lagging badly.
Foreign news: The U.S. announced over the weekend that nine thousand U.S. troops will be leaving Germany. Relations between Berlin and Washington have been strained for some time; while some commentators are suggesting this decision is supportive for Russia, that may not be the case. Poland is hoping that the U.S. will move these forces to its soil. The U.S. is threatening both the EU and China over lobster tariffs. EU support has, for now, reduced financial stress in Italy.
OPEC: As expected, OPEC and Russia have reached a deal to extend supply cuts. Russia and Saudi Arabia were able to corral some of the smaller producers in OPEC, which have been overproducing; of course agreeing is one thing, cutting is another.
COVID-19: The number of reported cases is 7,036,623 with 403,131 deaths and 3,153,223 recoveries. In the U.S., there are 1,942,363 confirmed cases with 108,211 deaths and 506,367 recoveries. For those who like to keep score at home, the FT has created a nifty interactive chart that allows one to compare cases across nations using similar scaling metrics. The news surrounding the virus, across the world, is the next phase of the crisis—the reopening. Europe is easing restrictions; British pubs are scheduled to reopen June 22. As we are seeing in the U.S., there are regional differences, with some European nations opening to all travelers, others creating travel bubbles, allowing free entry of some nations, restrictions from others. Meanwhile, in the U.S., New York is starting to reopen. In the U.S., there is evidence that as social distancing restrictions ease, infections are rising. This should be no surprise. The point of the lockdowns were to control the rise of infections so the health system could cope. However, the economic costs of the lockdowns were high and, barring a mutation in the virus that turns it into something with a fatality ratio similar to smallpox, we doubt we will see broad lockdowns repeated. Thus, the fear of the “rise in autumn” that is often discussed is probably not that great of a risk to the economy. Instead, we expect to see targeted measures, which would protect the most vulnerable from infection while leaving the rest of the economy to normalize. In Brazil, the government is limiting the release of virus data.
Monday charts: Here are three charts we have been working on. First, Friday’s employment data raised great hopes that a recovery is underway. We tend to agree with that idea; as we stated in a recent Asset Allocation Weekly, recoveries start when conditions stop getting worse. Given the catastrophic drop in growth, it should be no surprise that conditions are improving. However, it is important not to confuse the trough with the path of the recovery. The economy is in a deep hole that will take a long time to dig out of.
In this chart, we index the level of employment to the peak before the onset of recession. Each recession is measured to see how long it takes before the previous cycle high is met. There is nothing in the postwar experience that matches what we are seeing here. So, if policymakers take Friday’s data as a reason to hold off on additional stimulus, it could be an epic mistake.
Meanwhile, the recovery in equities has been surprising. This chart shows the weekly Friday closes from the onset of recession; we rebased the S&P to the market peak prior to the beginning of each recession.
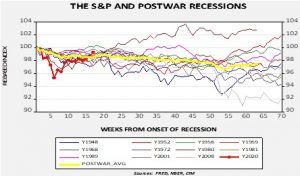
Two things are notable about the current cycle. First, the decline was the fastest in the postwar experience. The cascading decline in February and March was extremely fast. Second, the recovery has been remarkable as well. Only two earlier recessions, the 2001 and 1956, have the index higher than we are currently. The 2001 recession was very mild; the 1956 recession occurred during the Asian flu pandemic, although the drop was mostly attributed to monetary policy. The 1956 recession was very deep but short, which is similar to what we are expecting. Here is a note of caution; the average line shows that sideways performance tends to follow once the initial bounce occurs. We would not be surprised to see markets consolidate at some point. On the other hand, we have never seen this degree of policy support in the postwar world.
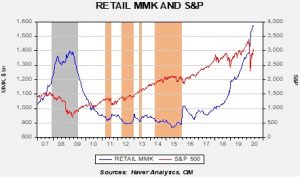
Finally, this is the weekly S&P chart compared to retail MMK fund levels[1]; the orange bars show periods where MMK fell below $920 billion, which tended to coincide with market consolidations. We have been noting rising caution among retail investors since 2018 when the trade conflict with China escalated. Even with the strong rally in equities from Q3 2018 into Q3 2019, retail MMK continued to rise. Cash levels have continued to rise through the recent decline and recovery in the S&P. Note that the bull market that began in March 2009 was fueled by a decline in retail MMK; if a similar pattern develops in this cycle, we could see further gains in equities.