

Daily Comment (June 15, 2017)
by Bill O’Grady, Kaisa Stucke, and Thomas Wash
[Posted: 9:30 AM EDT] There were three items dominating the overnight news. First, the shooting at the GOP baseball practice yesterday continues to reverberate. We will have more to say about this event in the future but it is further evidence of deep divisions within American society that show no signs of improving. Second, the BOE followed script and held policy steady. However, the vote was 5-3, with the dissenters calling for rate hikes. The strength of dissent caught the markets by surprise; the GBP rallied off its lows (the dollar has been stronger today) and Gilt yields jumped. Financial markets in Britain have been leaning toward rate cuts. The high level of dissent suggests that cuts will be difficult. Third, we are seeing further fallout from yesterday’s FOMC meeting; the dollar is up, gold and equities are lower and Treasury yields, which fell yesterday, are recovering a bit this morning.
The FOMC did as expected, raising rates by 25 bps. The comments about the economy remain upbeat but the lack of inflation was noted. The big news was that the balance sheet reduction is expected to start later this year, perhaps as soon as September. At some point this year, which remains unspecified, the Fed will begin allowing the balance sheet to decline by $10 bn per month, increasing by the same amount every three months until it reaches a maximum decline rate of $50 bn per month within five quarters. There will be a 60/40 split on Treasury and mortgages, respectively. We do have concerns about the balance sheet; in theory, since most of QE has been sitting innocuously on commercial bank balance sheets, removing it shouldn’t be a big deal. In reality, we simply don’t know how the market will react. If the behavior is symmetrical, it should “double down” on the idea that the Fed is tightening policy. There was one dissenter, Minneapolis FRB President Kashkari, who wanted to maintain the current rate.
Here are some relevant charts:
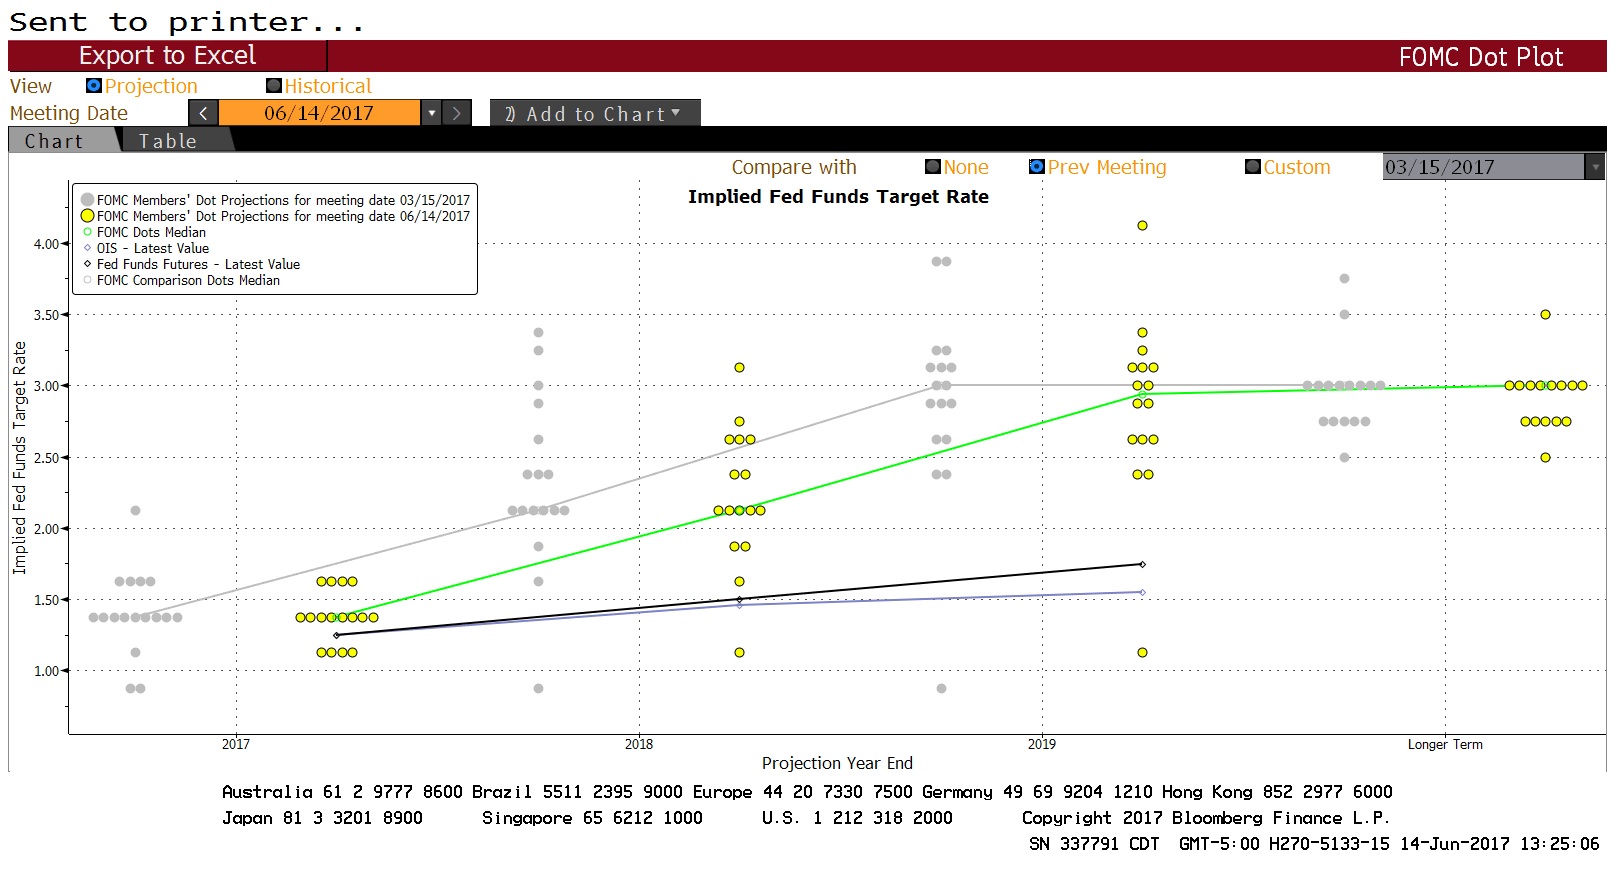
This shows the dispersion of the dots chart. The green line plots the median from yesterday’s meeting, while the gray shows the previous meeting. There wasn’t any change for the next two years but a modest decline in 2019. The median does suggest a 2.25% peak rate for next year, with only one more hike forecast this year and at least three hikes would be scheduled for next year. The market doesn’t expect this pace of hikes.
Here is our average dots chart:
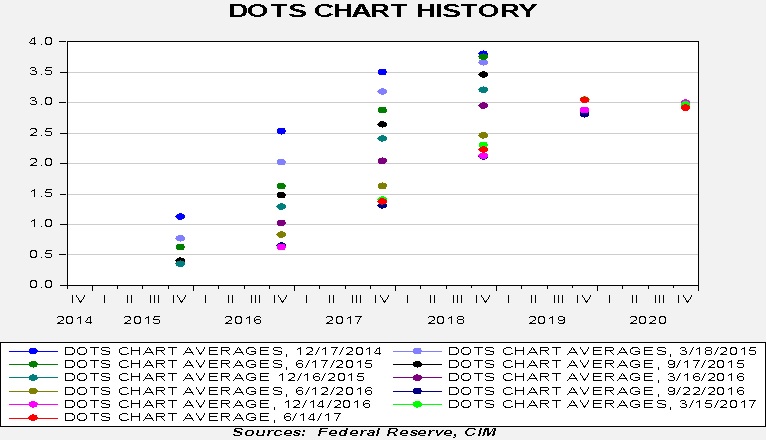
The most recent dot is in red. The average suggests very little change in projections from the FOMC. The history of the dots chart is one of a steady decline in projections. However, for the past several quarters, there has been a stabilization of expectations, suggesting the FOMC is becoming comfortable with its policy path.
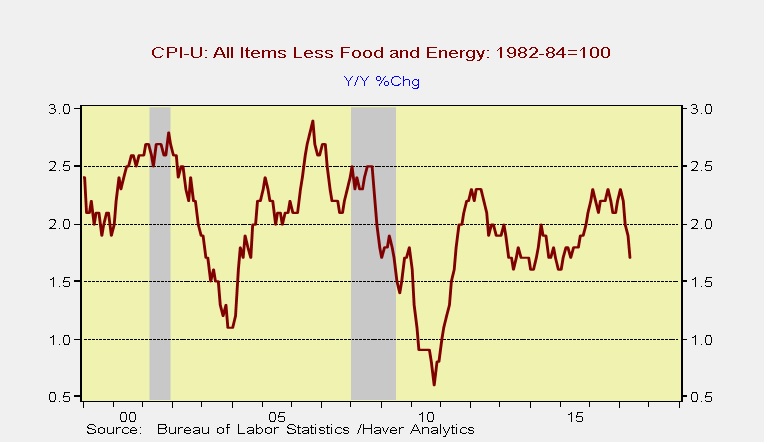
With the release of the CPI data and yesterday’s FOMC action, we can upgrade the Mankiw Rule models. The dip in the core CPI rate (see below) did affect the Mankiw Rule model results.
The Mankiw Rule models attempt to determine the neutral rate for fed funds, which is a rate that is neither accommodative nor stimulative. Mankiw’s model is a variation of the Taylor Rule. The latter measures the neutral rate using core CPI and the difference between GDP and potential GDP, which is an estimate of slack in the economy. Potential GDP cannot be directly observed, only estimated. To overcome this problem with potential GDP, Mankiw used the unemployment rate as a proxy for economic slack. We have created four versions of the rule, one that follows the original construction by using the unemployment rate as a measure of slack, a second that uses the employment/population ratio, a third using involuntary part-time workers as a percentage of the total labor force and a fourth using yearly wage growth for non-supervisory workers.
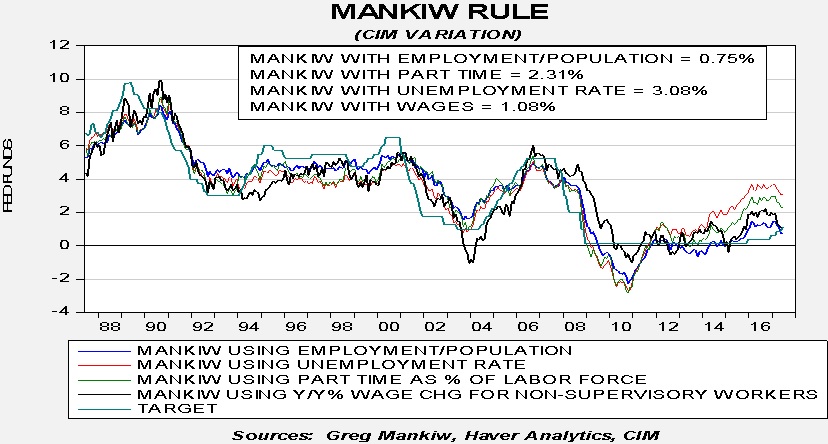
Using the unemployment rate, the neutral rate is now 3.08%. Using the employment/population ratio, the neutral rate is 0.75%. Using involuntary part-time employment, the neutral rate is 2.31%. Using wage growth for non-supervisory workers, the neutral rate is 1.08%. The labor data is mixed, with the employment/population ratio falling and wage growth stagnant, while the unemployment rate fell and involuntary part-time employment was steady. The drop in core CPI has led to lower Mankiw neutral rate estimates across the board.
To a great extent, the issue for policymakers remains the proper measure of slack. The danger for the financial markets is if the proper measure is wage growth or the employment/population ratio but policymakers believe slack is best measured by involuntary part-time employment or the unemployment rate. If that is their measure, policymakers will likely overtighten and prompt a recession. For the past couple of years, this issue has been mostly academic. Regardless of the measurement of slack, policy was generally accommodative. Now, using either wage growth or the employment/population ratio, monetary policy has achieved neutrality. If rates are raised as projected by the dots chart, assuming no change in inflation, the policy rate will reach a level consistent with tight policy with another two rate increases. Thus, we are now entering a more dangerous period for the economy where a policy mistake will matter.
U.S. crude oil inventories fell 1.7 mb compared to market expectations of a 2.3 mb draw.
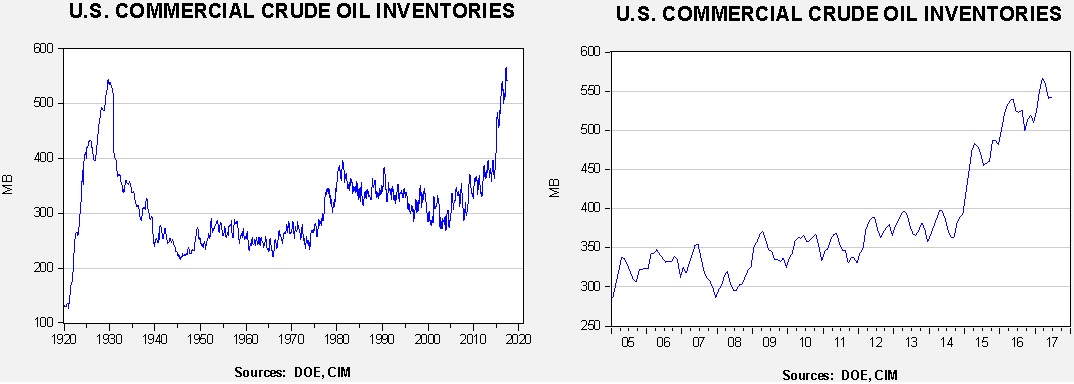
This chart shows current crude oil inventories, both over the long term and the last decade. We have added the estimated level of lease stocks to maintain the consistency of the data. As the chart shows, inventories remain historically high but they are declining. We also note that, as part of an Obama era agreement, there was a 0.4 mb sale of oil out of the Strategic Petroleum Reserve. This is part of a $375.4 mm sale (or 8.0 mb) done, in part, to pay for modernization of the SPR facilities. International agreements require that OECD nations hold 90 days of imports in storage. Due to falling imports, the current coverage is near 140 days. Taking that into account, the draw would have been 2.1 mb, which is near forecast.
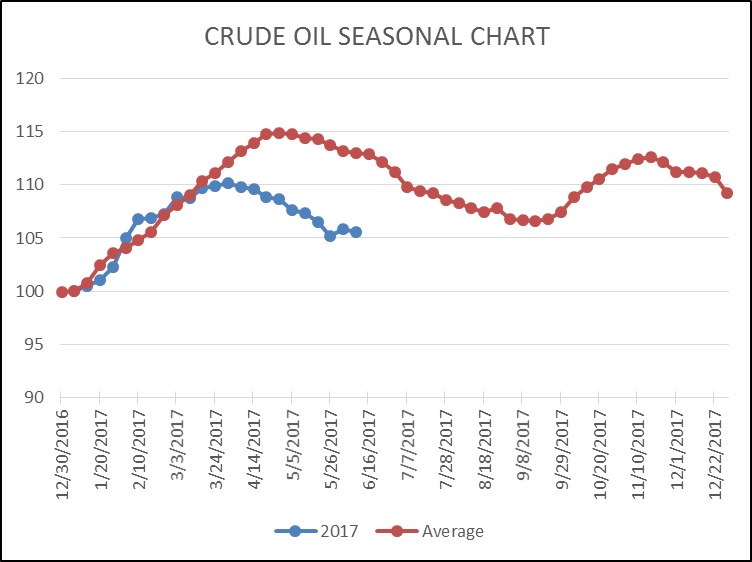
As the seasonal chart below shows, inventories are usually well into the seasonal withdrawal period. This year, that process began early. Although the actual level of stockpiles remains quite high, we have seen rather sharp stock declines until the past two weeks. We would expect the draws to increase as the recent rise in imports should fade.
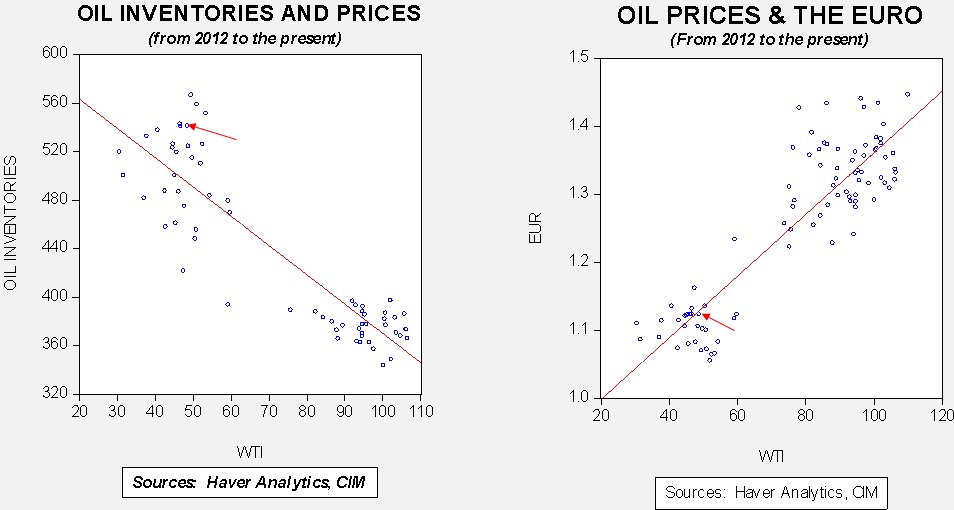
Based on inventories alone, oil prices are overvalued with the fair value price of $37.65. Meanwhile, the EUR/WTI model generates a fair value of $52.56. Together (which is a more sound methodology), fair value is $48.00, meaning that current prices are well below fair value. Currently, prices are below our expected trading range; we view oil prices as attractive on a short-term trading basis.
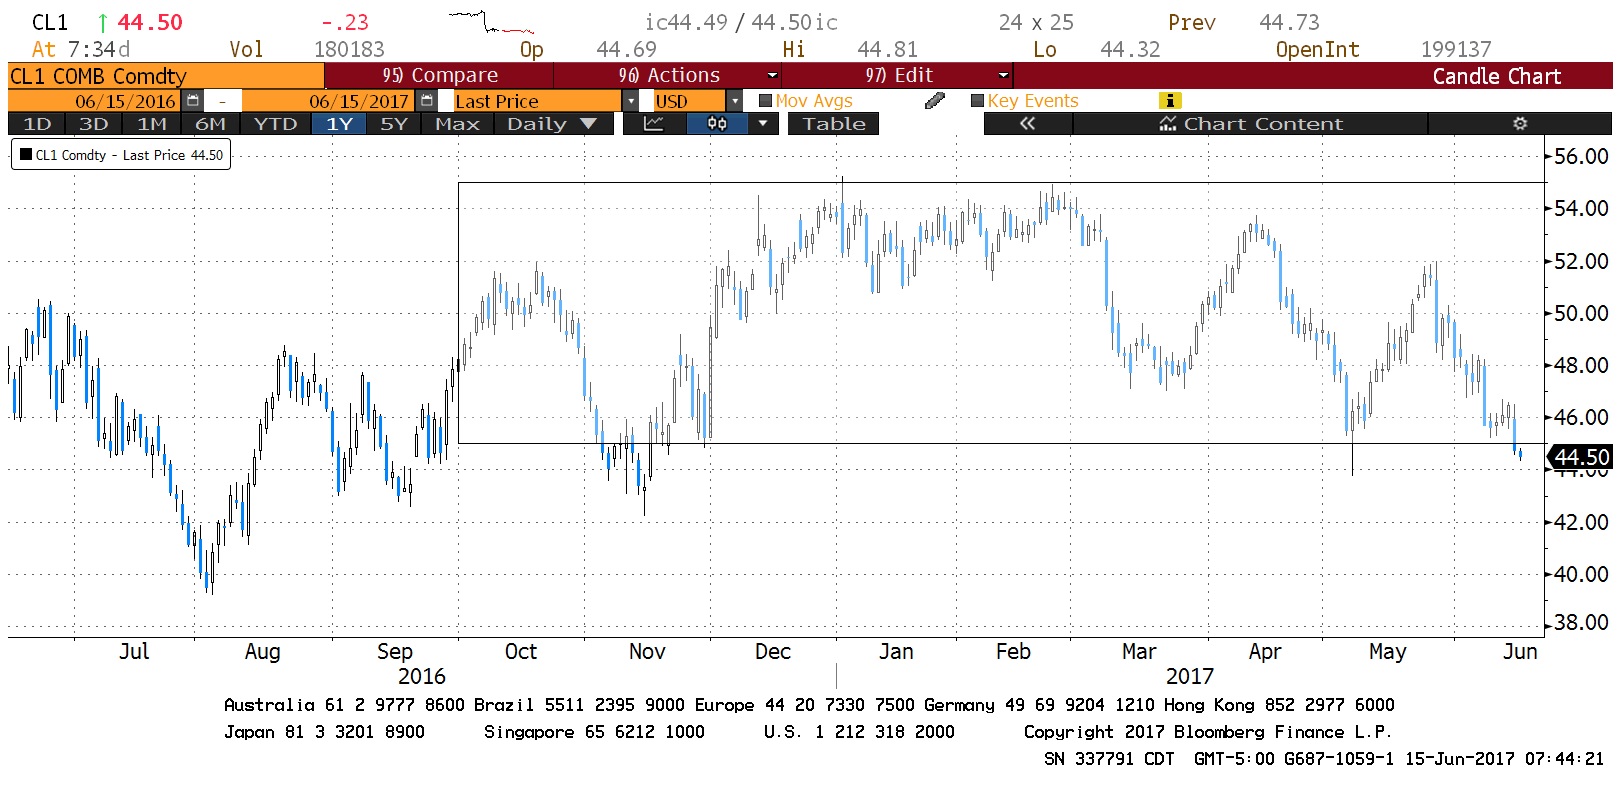
This chart shows the nearest WTI futures price. We have drawn a box between $45 and $55 per barrel. Note that since early October, nearly all prices fall within this range. This range has developed because OPEC’s cuts are being offset by rising U.S., Canadian and Brazilian output, leaving a mostly balanced market. As the chart shows, prices at this level have been attractive entry points. Of course, the risk is that we are seeing a downside breakout but we view further weakness as unlikely without strong evidence of OPEC cheating. Thus, a recovery should develop in the coming weeks.