

Daily Comment (January 6, 2017)
by Bill O’Grady, Kaisa Stucke, and Thomas Wash
[Posted: 9:30 AM EST] Happy employment data day! We have the details below but, in general, the data was mostly in line with expectations. We did see a bit of wage growth which has been bearish for bonds but supportive for the dollar.
U.S. crude oil inventories fell 7.1 mb compared to market expectations of a 2.0 mb draw. The large drop is mostly due to seasonal factors. At year’s end, firms have an incentive to lower stockpiles for tax reasons. We do note that product inventories jumped last week.
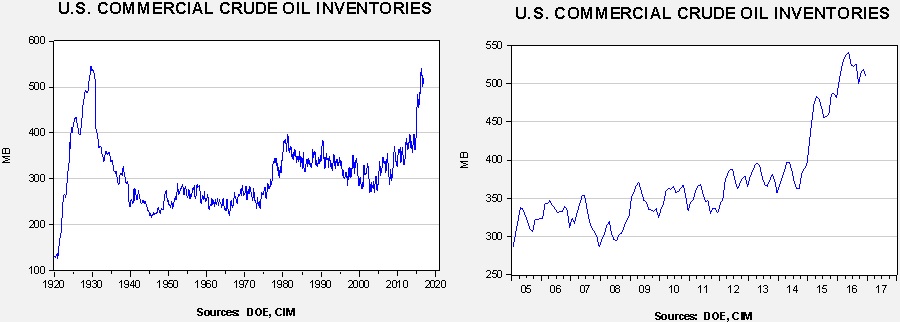
This chart shows current crude oil inventories, both over the long term and the last decade. We have added the estimated level of lease stocks to maintain the consistency of the data. As the chart below shows, inventories remain elevated.
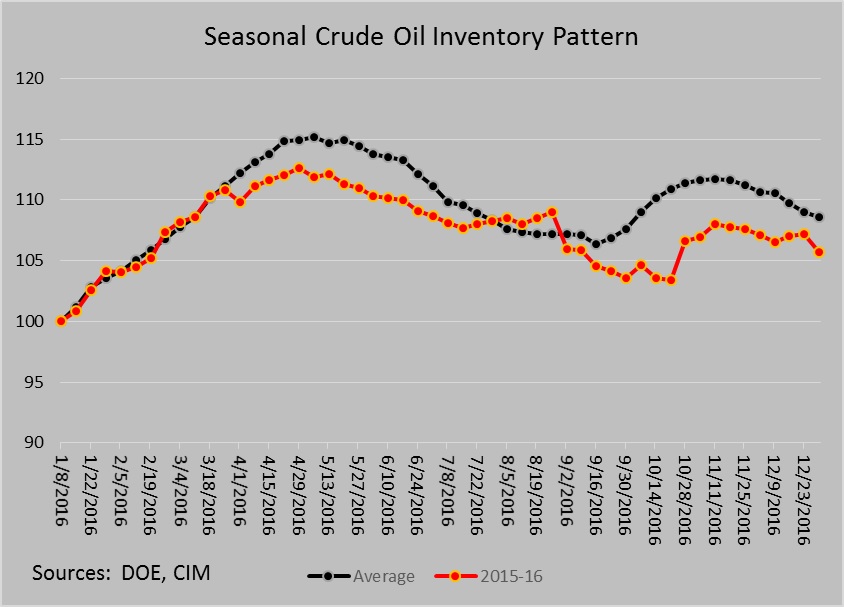
The annual seasonal pattern shows that inventories fell more than the seasonal pattern suggested they should. It is important to note that we are heading into an inventory accumulation period that will last into April. If OPEC is having success in reducing supply, we should see a slower than normal rise in inventories this year.
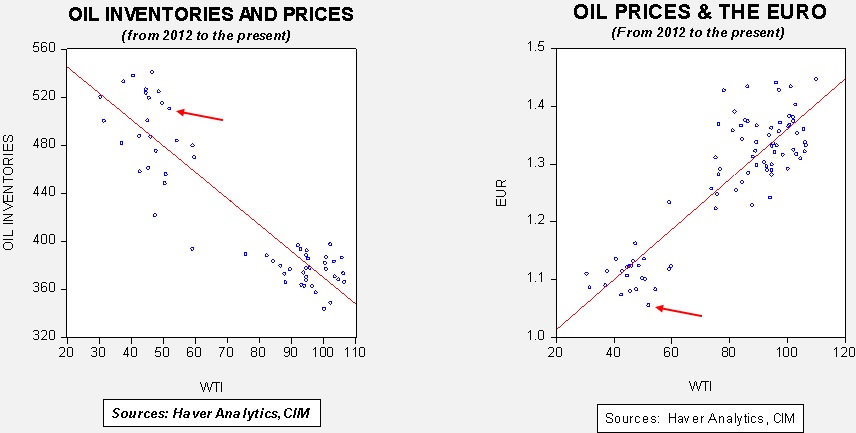
Based on inventories alone, oil prices are overvalued with the fair value price of $42.77. Meanwhile, the EUR/WTI model generates a fair value of $35.32. Together (which is a more sound methodology), fair value is $35.86, meaning that current prices are well above fair value. OPEC has managed to lift prices but maintaining these levels will be a challenge given the dollar’s strength and the continued elevated levels of inventories.
On a related note, employment in oil and gas extraction hasn’t started to lift yet.
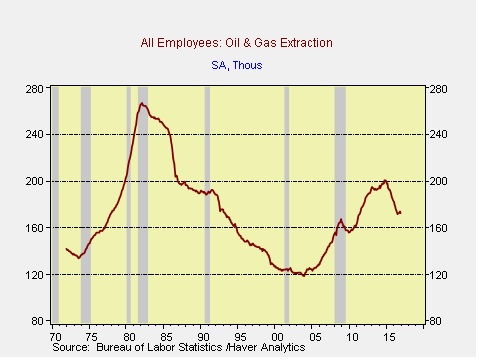
However, we have seen stable levels of employment in oil and gas extraction since mid-2016.