

Daily Comment (January 12, 2017)
by Bill O’Grady, Kaisa Stucke, and Thomas Wash
[Posted: 9:30 AM EST] The primary market theme this morning appears to be a broad reversal of the so-called “Trump trades” that have dominated the markets since the election. We are seeing weaker equities globally and the dollar is weaker, while Treasuries and gold are doing better. There are two factors that need to be separated from these markets moves. First, a portion of this action is simply normal market adjustment. The trend in the Trump trades has been pronounced and relentless. Some market reversals for profit taking and position squaring make sense. Second, one must determine where the interpretation of the Trump trades may have been in error. The idea is that reversals that are merely “a pause to refresh” should be viewed as positioning opportunities. Reversals based on mistakes may have more “legs.”
For example, it’s hard to see how trade restrictions will be bullish for bonds or stocks. Deglobalization will tend to be inflationary, leading the Fed to raise rates and generally leaning against profit margins and growth. Thus, the rise in bond yields make sense; the broad rally in equities less so. This doesn’t mean that certain parts of the equity markets won’t do well. Financials will be supported by regulatory relief and rising rates. Energy should receive regulatory relief and the Ryan tax plan may tax oil imports, giving more support for domestic small cap equities. Small and mid-cap stocks, due to their lower exposure to overseas markets, should outperform large caps. However, populist policies favor equality over efficiency, which isn’t good for capital because it favors labor. Thus, Trump’s policies may prove to be less supportive for the broad equity market, and consequently the fall in bond yields probably wouldn’t last and any weakness that develops in energy or financials may be a buying opportunity.
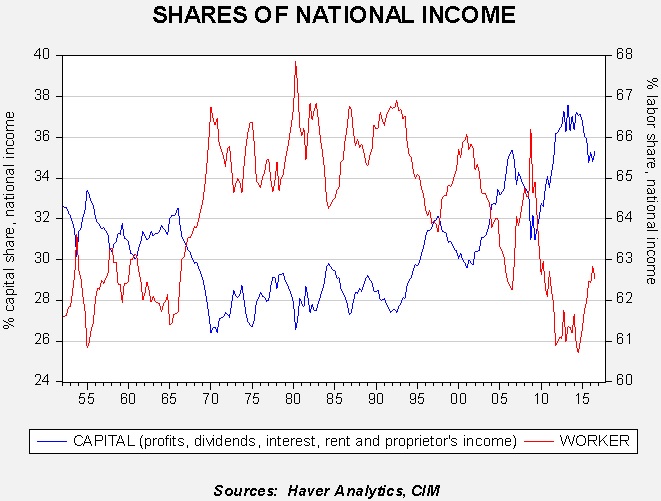
This chart shows the distribution of national income to capital and labor (the numbers don’t exactly add to 100 because we don’t include government’s share of national income). From the late 1960s into the early 1990s, labor’s share averaged around 66% and capital about 28%. Since the early 1990s, capital has been gaining share in each expansion cycle of the business cycle. The current average share of labor in this expansion is around 61.5% compared to 36% for capital. The deteriorating position of labor is probably behind the rise of populism.
Trump’s policies against trade are, in part, a bid to improve the labor share at the expense of capital. These measures may not help all that much because, in a floating exchange rate environment, the dollar will likely rise to offset many of these measures. This morning, for example, we are seeing a sharp drop in the dollar; although the dollar is technically overbought and due for correction, we expect Trump’s tax and trade policies to lead to dollar strength. About the only way that the dollar’s rise can be stopped is if the Federal Reserve is badgered into holding rates steady. We would not expect this outcome; thus, we see the dollar’s weakness as a technical correction, not a longer term change in trend.
Finally, as a side note, the Italian Constitutional Court rejected a request for a referendum on Renzi’s labor market reform. This union-led request, if allowed, would have probably triggered new elections. By rejecting the bid, the odds of an Italian election this year are reduced.
U.S. crude oil inventories rose 4.1 mb compared to market expectations of a 2.0 mb build.
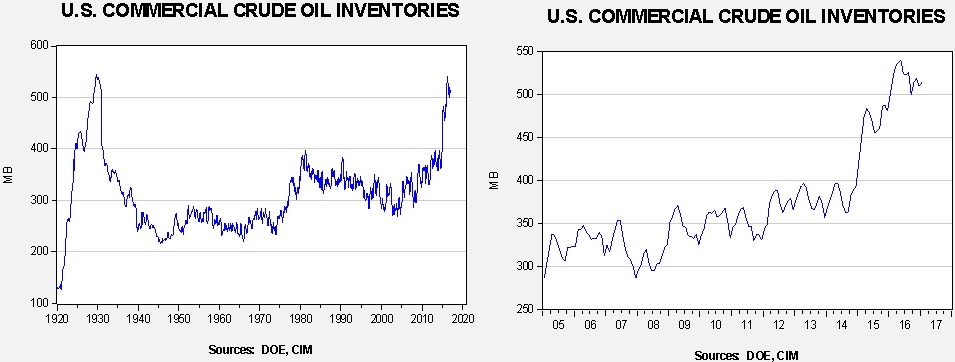
This chart shows current crude oil inventories, both over the long term and the last decade. We have added the estimated level of lease stocks to maintain the consistency of the data. As the chart below shows, inventories remain elevated.
We won’t publish the annual seasonal pattern chart this week because, by design, the first week isn’t meaningful. It will return next week. We do note that the build is rather large this week which suggests OPEC cuts have not affected U.S. supply. Of course, now that the cartel is officially reducing production, we should see a slower than normal build in the coming week.
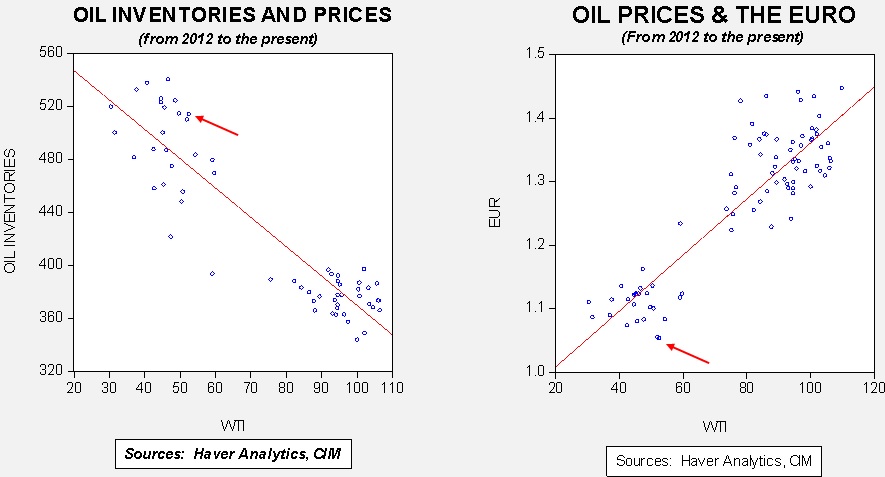
Based on inventories alone, oil prices are overvalued with the fair value price of $41.79. Meanwhile, the EUR/WTI model generates a fair value of $35.94. Together (which is a more sound methodology), fair value is $36.05, meaning that current prices are well above fair value. OPEC has managed to lift prices but maintaining these levels will be a challenge given the dollar’s strength and the continued elevated levels of inventories.