

Daily Comment (February 5, 2018)
by Bill O’Grady and Thomas Wash
[Posted: 9:30 AM EST] It’s another down day for the broad swath of financial markets. We are seeing weakness in equities; bonds have started to stabilize but we are seeing a rapid steepening of the yield curve. Market action has been mostly controlled with little evidence of panic…so far. Here is what we are watching today:
Equity issues: One of the key characteristics of this bull market has been the lack of volatility. We have experienced long stretches with no corrections. We see a couple reasons for this pattern. First, the FOMC has been transparent about monetary policy; in addition, policy has been accommodative. Second, inflation and fears of inflation have been low. The combination of clear policy and low inflation has reduced the fears of owning equities. There is evidence the combination of these factors is starting to change. First, although monetary policy remains transparent, it is becoming less accommodative as the market looks for at least three, if not four, rate hikes this year. Second, inflation fears are rising. The wage data from last week’s employment report showed a 2.9% increase in overall wages, although we did note that the gain was a much more modest 2.4% for non-supervisory workers. Until the latter accelerates notably, we think inflation fears may be overdone.
Inflation is the key issue. When inflation rises, the correlation between stocks and bonds tends to turn positive, undermining diversification. Under these conditions, bond and stock prices fall simultaneously. That is the situation we are seeing now. Whether or not it continues depends on the actual process of inflation. In the short run, we look for a modest rise in price levels, with the core rate of CPI moving to around 2.5% by early 2019. That rate is obviously higher than what we are seeing but such a move should be manageable. The concern is, of course, whether the FOMC overreacts to this rise in price levels and tightens policy to the point where a recession is triggered. At this juncture, there isn’t much evidence to suggest a recession is in the cards over the next couple of quarters. Thus, the elements of a major sell-off in equities aren’t likely.
Instead, it appears what we are witnessing is a fairly normal decline in stocks. Since 1928, a 5% drop in equities occurs about 3.4 times per year. Corrections (10% declines) occur 1.1 times per year. The last 10% drop occurred in late 2015. We are clearly due for a pullback.
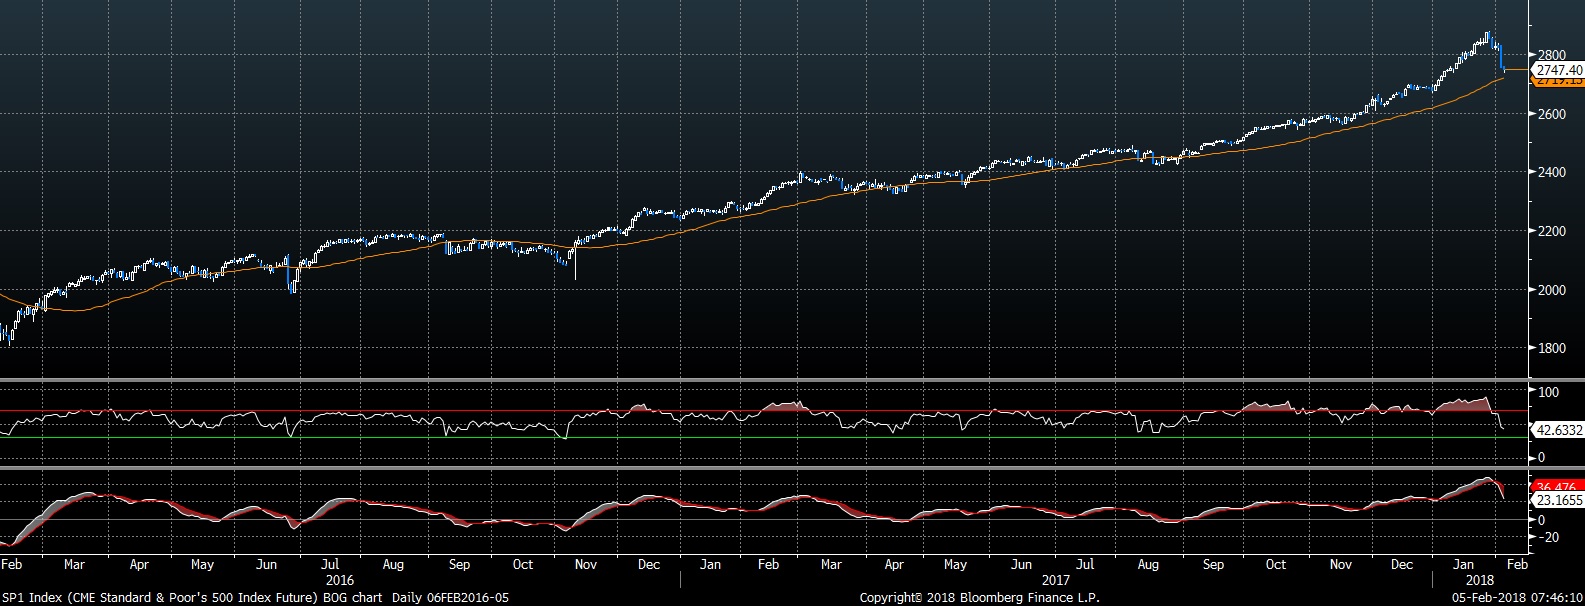
This chart shows the nearest futures contract for the S&P 500. Technically, we are approaching the 50-day moving average, which may be a support area. The lower segments on the chart show the Relative Strength Index and the Moving Average Convergence/Divergence indicator. The RSI has moved from overvalued to the balanced area. It has not achieved an oversold level, which would be below the lower green line. The MACD has rolled over but hasn’t shown signs of consolidation. The charts suggest a good bit of the excess has been worked off but we are still facing further downside.
No German coalition yet: The SDP and CDU/CSU missed their weekend deadline but talks are continuing today. We still expect a deal to be struck, but the longer this goes on, the more pressure will develop on the EUR.
Sanctions on Venezuela? SOS Tillerson indicated that the U.S. is considering restricting imports of Venezuelan oil and cutting off exports of product to Caracas. If this step is taken, it will roil the U.S. and foreign oil markets. Although Venezuela will try to sell its oil to other buyers, the characteristics of its oil (heavy and sour) are best for the U.S. refining industry. We suspect further sanctions will cut global oil supplies and boost prices.