

Daily Comment (February 14, 2019)
by Bill O’Grady and Thomas Wash
[Posted: 9:30 AM EDT] Happy St. Valentine’s Day! U.S. equity futures are trending higher this morning in quiet trading. Here is what we are watching:
White House calming markets: The president is reportedly considering pushing back the trade deadline by 60 days and backing a border security bill that would avoid another shutdown. As we have mentioned in the past, the president, who is likely gearing up for reelection, will look to tie up loose ends going into 2020. As a result, we expect market volatility to simmer down as the president is unlikely to push for legislation that could endanger his reelection chances.
Money market fund levels remain elevated: Although equity markets have recovered, the level of retail money market funds remains elevated.
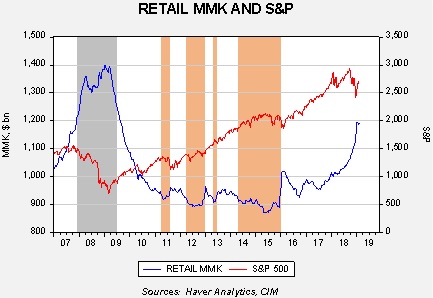
This chart shows the weekly close for the S&P 500 with the weekly level of retail money market funds. Beginning in early 2018, money market funds have been rising rapidly, eerily tracking what we saw in 2007. This suggests to us that some of this liquidity preference was being driven by investor fear. It is true that money market yields have increased but we doubt they have moved up enough to account for this desire to hold cash.
During this bull market, the S&P has tended to stall when retail money market levels fall below $920 bn, suggesting the equity market “ran out of liquidity”; these events are shown by vertical orange bars. At present, even with the rally we have seen in equities this year, money market funds remain high. If investor sentiment shifts, we would expect equities to benefit substantially.
Mankiw Rule update: The Taylor Rule is designed to calculate the neutral policy rate given core inflation and the measure of slack in the economy. John Taylor measured slack using the difference between actual GDP and potential GDP. The Taylor Rule assumes that the Fed should have an inflation target in its policy and should try to generate enough economic activity to maintain an economy near full utilization. The rule will generate an estimate of the neutral policy rate; in theory, if the current fed funds target is below the calculated rate then the central bank should raise rates. Greg Mankiw, a former chair of the Council of Economic Advisors in the Bush White House and current Harvard professor, developed a similar measure that substitutes the unemployment rate for the difficult to observe measure of potential GDP.
We have taken the original Mankiw rule and created three other variations. Specifically, our models use core CPI and either the unemployment rate, the employment/population ratio, involuntary part-time employment and yearly wage growth for non-supervisory workers. All four compare inflation and some measure of slack. Here is the most recent data:
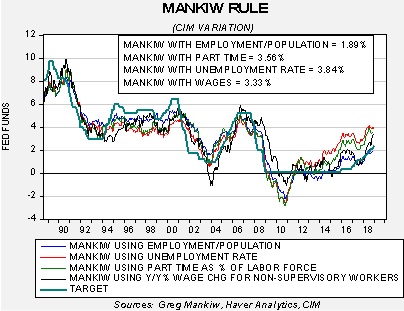
Three of the models would suggest the FOMC is well behind the curve and needs to be increasing the policy rate. However, the employment /population ratio does imply some slack in the economy and would suggest the Fed has already lifted rates more than necessary. Until recently, the wage variation was also suggesting caution. In September, it was signaling a neutral rate of 2.78%. However, as the line shows, the projected rate has moved up sharply as wages have increased. We suspect some of this wage increase has been mandated by various state and local increases in minimum wages. If so, the rise in wages should slow later this year.
Overall, FOMC behavior seems to be tracking the employment/population ratio, which makes sense given the modest increases we are seeing in inflation. If inflation follows the path of the manufacturing ISM, we could see a modest uptick in price levels later this year.
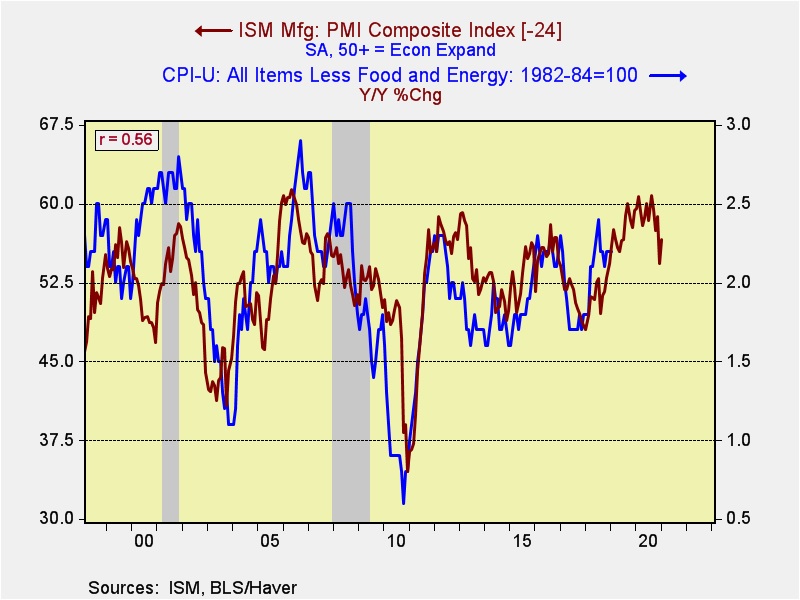
The current employment/population ratio with 2.5% core CPI would generate a neutral policy rate of around 2.5%, suggesting the FOMC should not raise rates further assuming the projected rise in inflation is correct.
Energy update: Crude oil inventories rose 3.6 mb last week compared to the forecast rise of 2.4 mb.
In the details, estimated U.S. production was unchanged at 11.9 mbpd. Crude oil imports fell by 0.9 mbpd, while exports fell 0.5 mbpd. Refinery runs fell sharply, by 4.8%, compared to expectations of a 0.9% decline.
The decline in runs was significant and is a clear signal that the refinery maintenance season is underway.
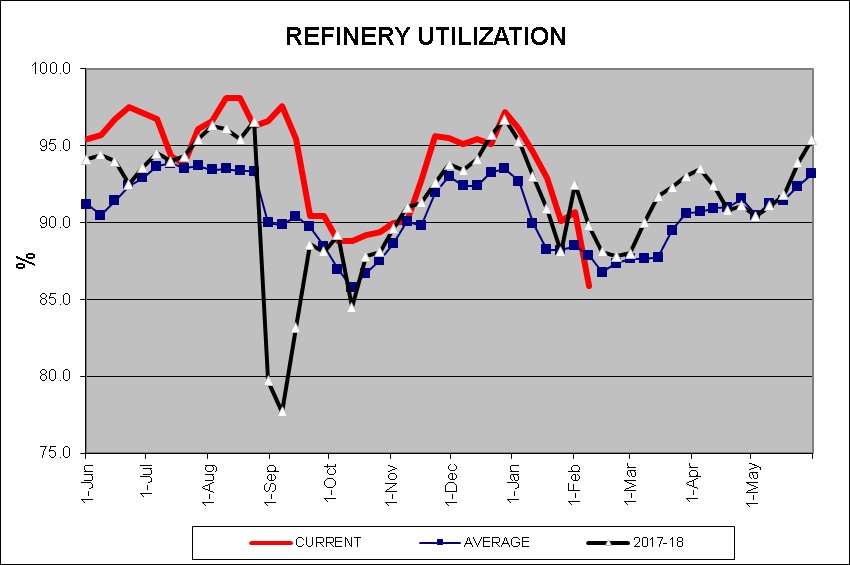
On average, refinery utilization should stabilize at these levels through most of March and then rise as spring comes to the Northern Hemisphere. This will tend to reduce U.S. oil demand for the next several weeks and usually lead to rising crude oil inventories.
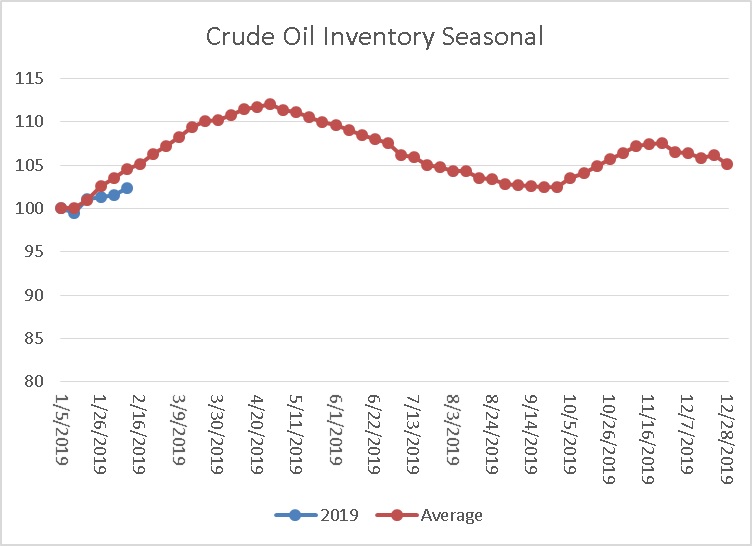
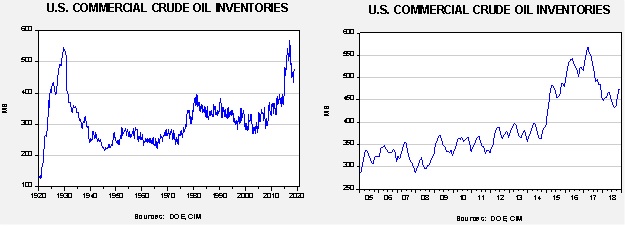
This is the seasonal pattern chart for commercial crude oil inventories. We would expect to see a steady increase in inventories that will peak in early May; the pattern coincides with refinery maintenance. Note that inventories are rising at a slower pace than normal. This is mostly due to crude oil exports. If this slow pace continues, it would be a bullish factor for oil prices.
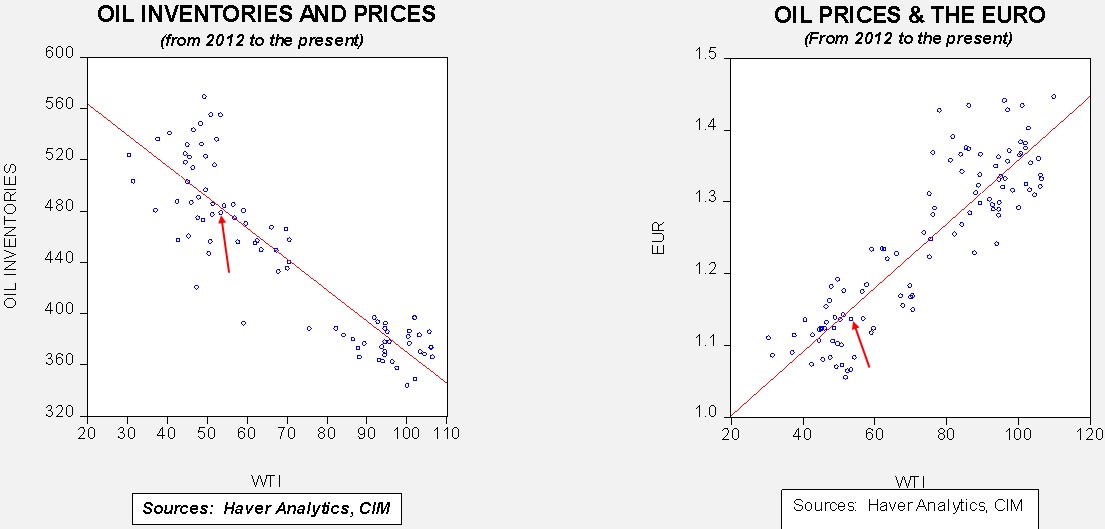
Based on oil inventories alone, fair value for crude oil is $58.26. Based on the EUR, fair value is $54.26. Using both independent variables, a more complete way of looking at the data, fair value is $54.89. By all these measures, current oil prices are generally in the neighborhood of fair value. However, we still expect prices to move toward $60 later this year on rising oil exports.