

Daily Comment (February 1, 2018)
by Bill O’Grady and Thomas Wash
[Posted: 9:30 AM EST]
The FOMC: The FOMC did what we expected; it held rates steady but prepared the market for new rate hikes. We currently expect three hikes this year but, given the overall hawkishness of the 2018 voters, we cannot rule out four hikes, especially if the economy continues on its current course. Financial markets are preparing for additional hikes.
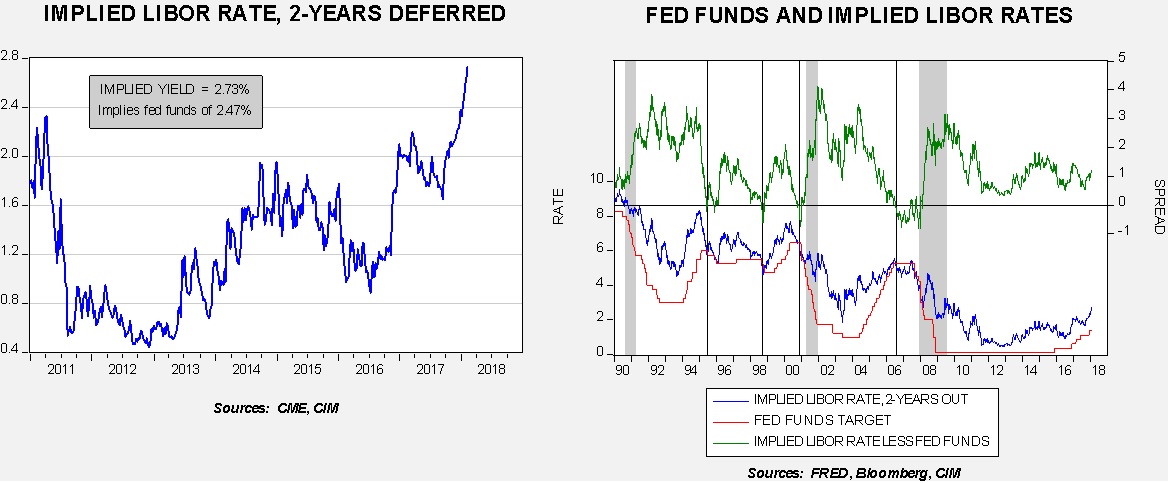
The chart on the left shows the implied three-month LIBOR rate from the Eurodollar futures market, two years deferred. In other words, it is the market’s projection of three-month LIBOR rates in Q1 2020. Since September 2017, this rate has moved higher at a solid pace and now has reached its highest level in nearly eight years. The Eurodollars are now projecting a fed funds rate of nearly 2.50% in two years. The chart on the right shows the aforementioned implied LIBOR rate with the fed funds target. The upper line on the chart shows the spread between the two rates. During tightening cycles, the FOMC tends to raise rates until the spread becomes negative (shown by vertical lines on the chart). The fact that the spread is widening despite tighter policy suggests we are likely moving into an accelerating phase of tightening.
T-notes approach 2.75%: The 10-year T-note yield has moved toward 2.75% this morning as the prospect of tighter monetary policy, rising European yields and higher oil prices have boosted yields. Although the rise in Treasury yields is a potential threat to the equity markets, in reality, we would need to see much higher yields for it to become a significant risk for stocks.
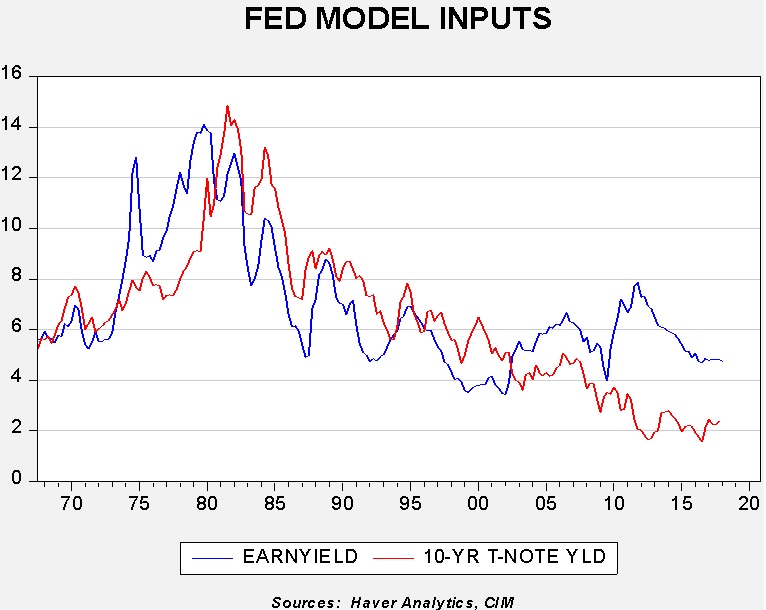
This chart shows the 10-year T-note yield and the S&P 500 earnings yield, the inverse of the P/E. For the P/E, we use the four-quarter trailing methodology, described in our weekly P/E chart. Although the so-called “Fed Model” has been around for a long time, in its raw form, it isn’t all that good of a predictor. During much of the 1980s, the earnings yield was below the 10-year yield, which is odd. Still, for most of this century, the earnings yield has been higher than the T-note yield. Regressing the two suggests that the current level is about at fair value; to get to where equites are expensive, the 10-year would need to reach around 4.25%. Of course, given the relative “looseness” of this relationship, we would expect a negative reaction from equities before then but this chart does suggest that it will take a larger move in rates to adversely impact equities.
Energy recap: U.S. crude oil inventories rose 6.8 mb compared to market expectations of a 3.0 mb build.
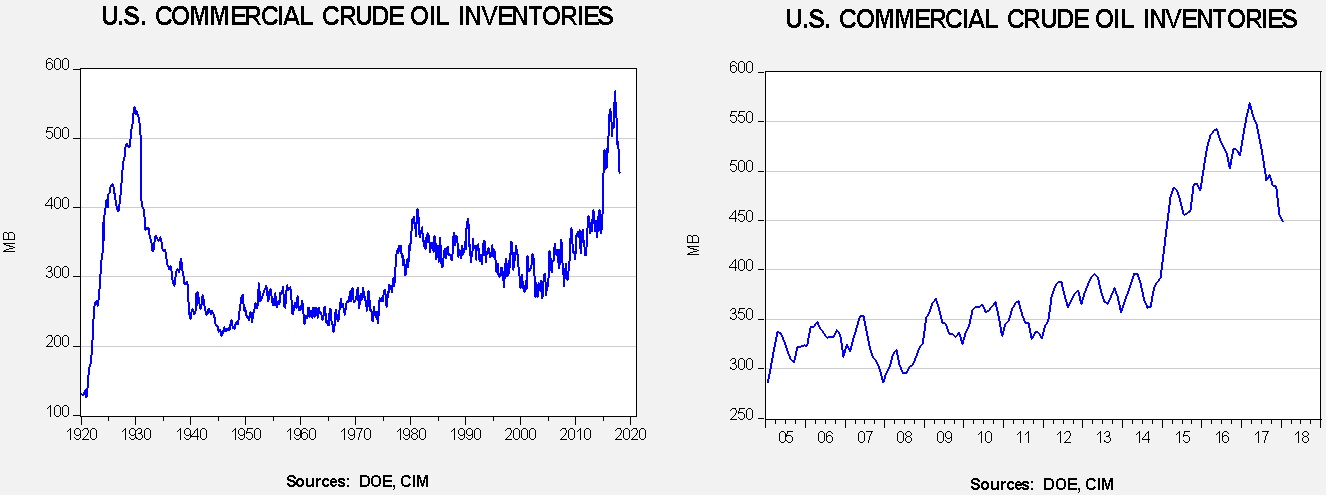
This chart shows current crude oil inventories, both over the long term and the last decade. We have added the estimated level of lease stocks to maintain the consistency of the data. As the chart shows, inventories remain historically high but have declined significantly since last March. We would consider the overhang closed if stocks fell under 400 mb.
As the seasonal chart below shows, inventories are usually rising this time of year. This week, we finally saw an increase as refinery operations declined.
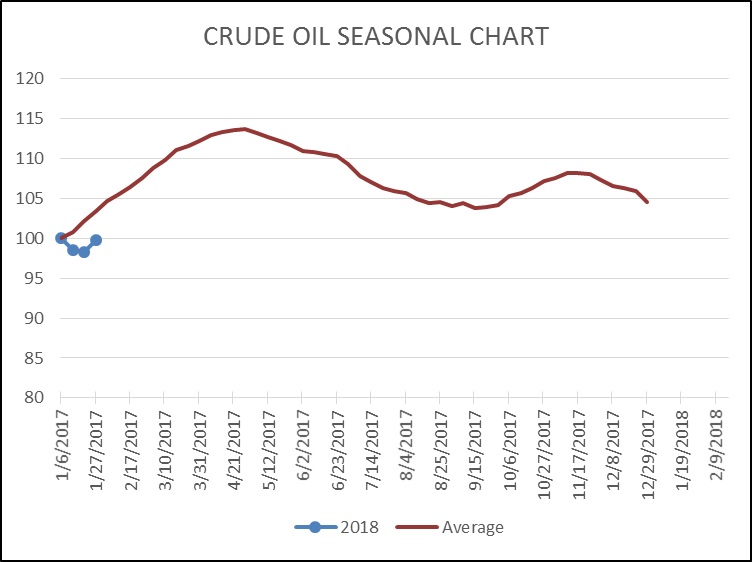
The rise is more normal and we would expect steady increases in stockpiles in the coming weeks until the refinery maintenance season comes to a close.
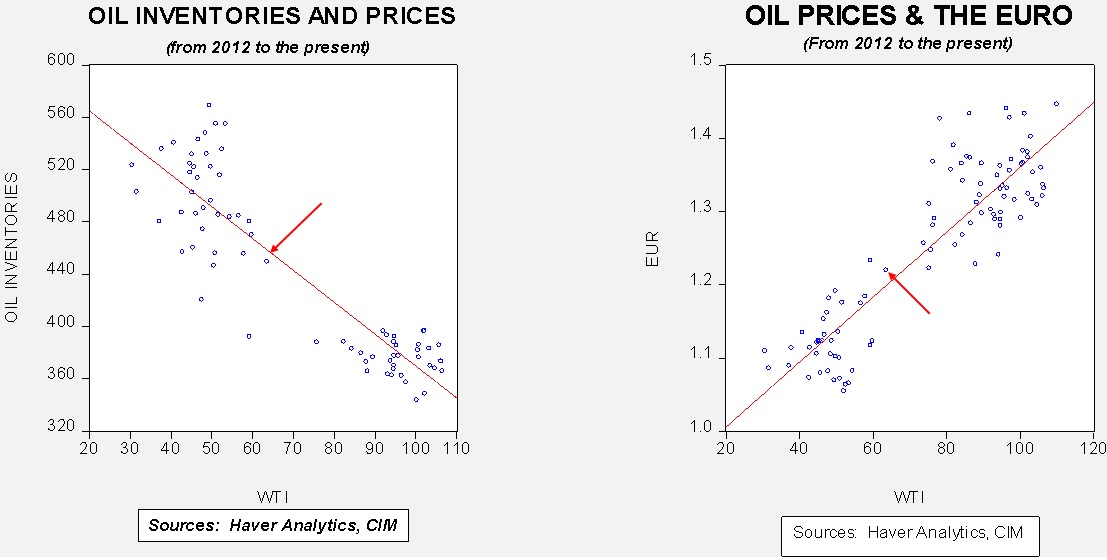
Based on inventories alone, oil prices are undervalued with the fair value price of $68.12. Meanwhile, the EUR/WTI model generates a fair value of $72.21. Together (which is a more sound methodology), fair value is $70.95, meaning that current prices, while elevated, are below fair value. The weak dollar and falling oil inventories are bullish for oil prices and suggest there is more upside, especially if inventories fail to rise in their normal seasonal fashion.
Yesterday, the DOE announced that official November U.S. oil production reached 10.0 mbpd for the first time since the early 1970s.
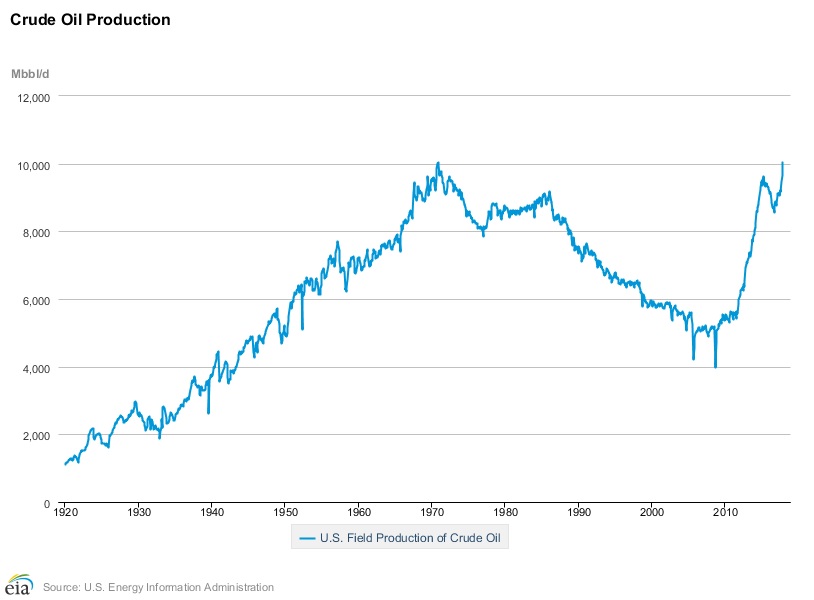
Although this news wasn’t an enormous surprise, it is still remarkable. It is interesting to note that the U.S. was producing just over 5.0 mbpd at the turn of the decade. Essentially, U.S. oil output has doubled in eight years.