

Daily Comment (December 21, 2017)
by Bill O’Grady and Thomas Wash
[Posted: 9:30 AM EST]
(Note to readers: The Daily Comment will go on hiatus after Friday; commentary will resume on January 2, 2018.)
Happy Solstice! Here is what we are watching this morning:
Tax bill passes: While there was some last-minute drama, the tax bill passed. We will be watching to see how the economy reacts, although our expectation is that the impact will be rather small. We have taken note of a few large firms that have announced increases in their minimum wage levels, a lift in investment and one-off bonuses due to the tax cut. We view these actions as mostly done for positive publicity; as a thought experiment, it’s worth noting that equity prices usually rise when firms announce layoffs. But, the actions will blunt some of the negative media coverage that has developed as part of the tax measure, giving pundits talking points.
Government funding: We don’t expect a shutdown (lawmakers want to get home for Christmas), but the rhetoric will get heated before a deal is completed. Expect a short-term funding agreement that will push the next “crisis” into late January.
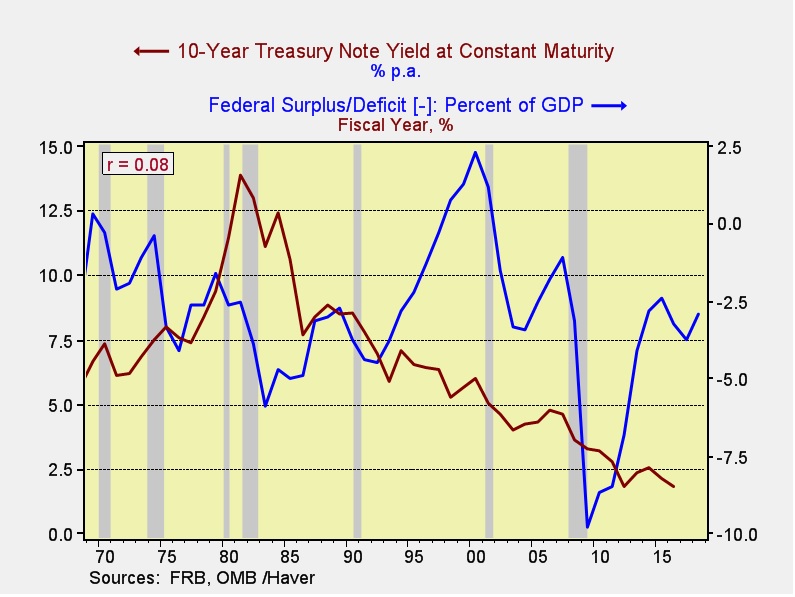
The bond market: We continue to see a backup in yields, especially at the long end of the curve. Concerns about the deficit expansion may be behind this rise but, in reality, the relationship between deficits and Treasury yields isn’t very strong. The chart below shows the fiscal deficit as a percentage of GDP and 10-year Treasury yields. The correlation is 0.08, which is virtually uncorrelated. The two most important variables to yields are the policy rate and inflation expectations. The rise we are seeing in long-term yields is a combination of fears of tightening monetary policy and the chance that the tax bill could boost inflation. After all, fiscal stimulus with a very low unemployment rate is a textbook combination designed to raise inflation. However, we aren’t all that worried because (a) we doubt the tax bill will have much of an impact on growth, and (b) any lift in growth will probably be offset by rising imports. At the same time, if the administration is successful in erecting trade barriers, our concern level would rise significantly. Thus, for now, we view the rise in bond yields as probably more of a year-end position-squaring event…but we are watching it closely.
Equities remain elevated: We have seen some weakness in the past couple of days, which we would attribute to profit-taking after the tax bill passed yesterday. Given the recent strength in the market, we want to examine a couple of indicators we monitor. First, retail money market funds continue to rise despite the strength in equities.
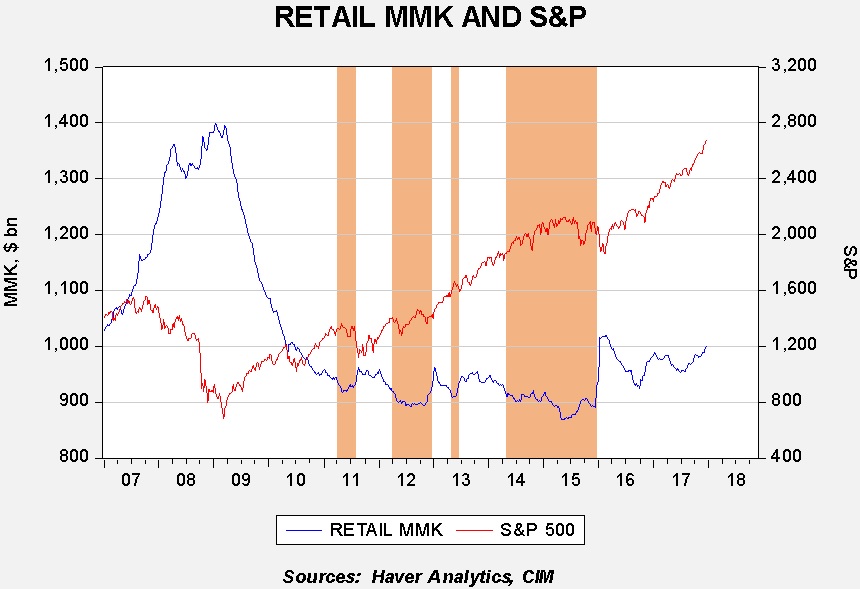
The orange bars on the chart show periods when retail money market funds have fallen to $920 bn or below. These tend to be periods when equities correct. We suspect this is because equities run out of liquidity to bid them higher. What is fascinating about the current rally is that it is occurring while retail money markets have increased to $1.2 trillion. It would appear that retail investors may not be fully participating in this recent leg up in equities. Second, flows into equity mutual funds and ETFs have slowed as well.
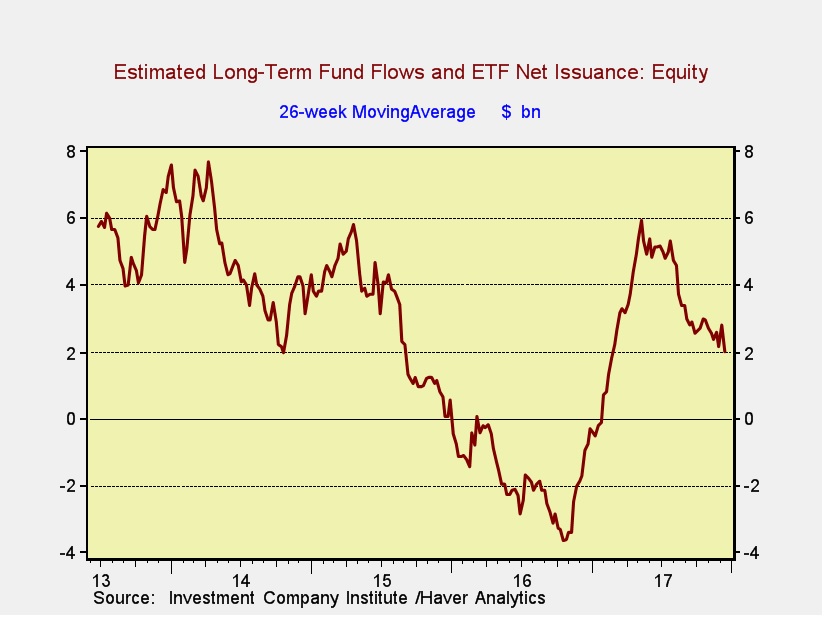
This chart shows the 26-week average of flows. Although they remain positive, the pace has slowed for new flows, confirming there is some slowing in instruments used by retail investors. This suggests to us that sentiment is not excessive (despite what the sentiment surveys suggest) and that further gains in equities are likely.
Energy recap: U.S. crude oil inventories fell 6.5 mb compared to market expectations of a 3.1 mb draw.
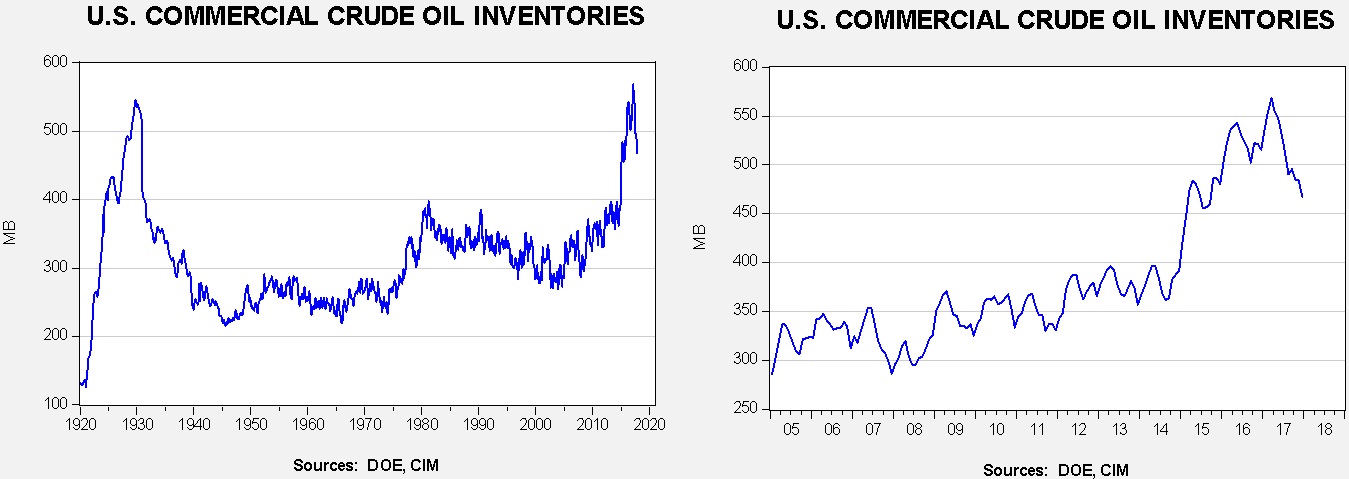
This chart shows current crude oil inventories, both over the long term and the last decade. We have added the estimated level of lease stocks to maintain the consistency of the data. As the chart shows, inventories remain historically high but have declined significantly this year. We also note the SPR rose by 0.4 mb, meaning the net draw was 6.1 mb.
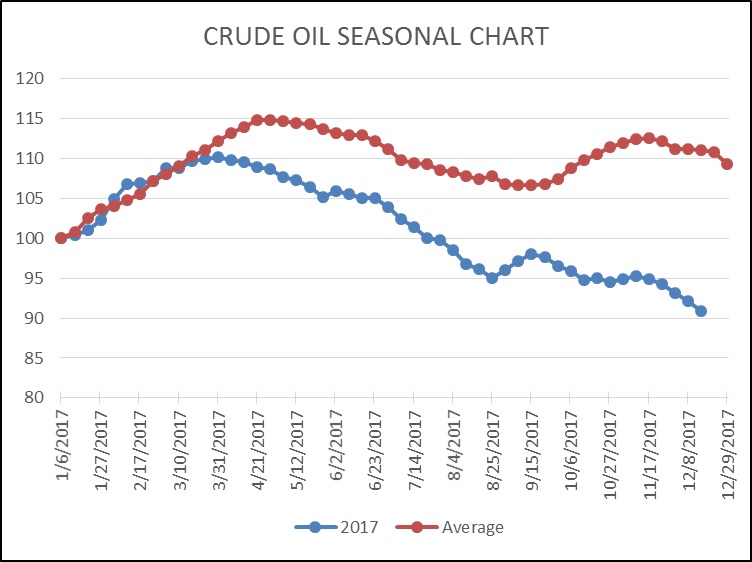
As the seasonal chart below shows, inventories fell this week. We are now nearing the end of the late Q4 seasonal draw. As the new year starts, stockpiles usually begin their largest seasonal build from early January into early April.
Oil prices rose on the bullish report.
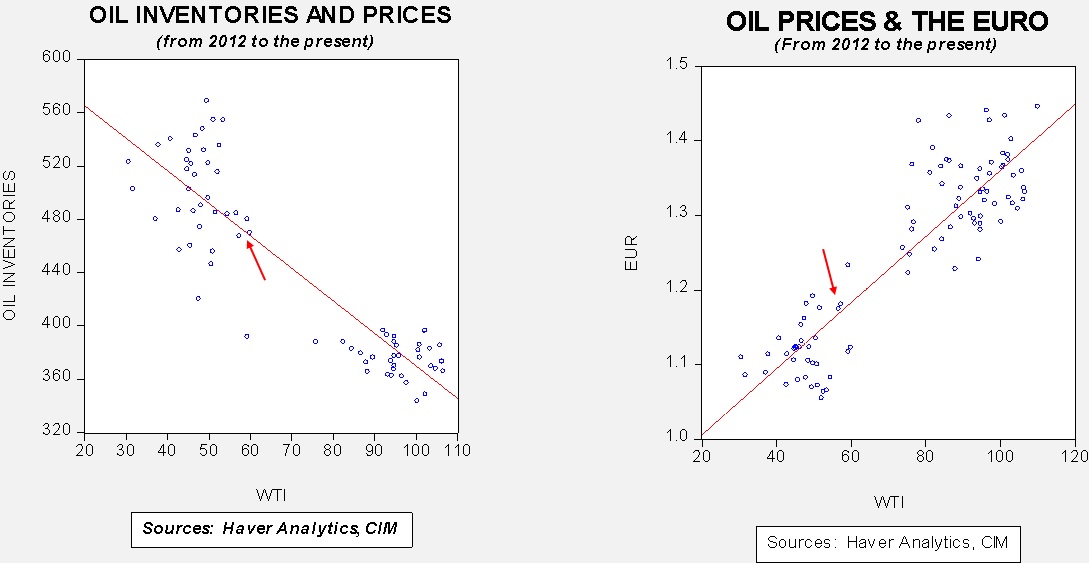
Based on inventories alone, oil prices are undervalued with the fair value price of $62.27. Meanwhile, the EUR/WTI model generates a fair value of $63.83. Together (which is a more sound methodology), fair value is $62.98, meaning that current prices are below fair value. Overall, oil prices are within normal ranges of current fundamentals but we are generally bullish toward crude oil at this time.