

Daily Comment (December 19, 2018)
by Bill O’Grady and Thomas Wash
[Posted: 9:30 AM EDT]
[N.B. The Daily Comment will go on holiday from December 24 to January 2. From all of us at Confluence, but especially Thomas and me, thanks for reading and have a Merry Christmas and Happy New Year!]
BREAKING NEWS: The U.S. is preparing to make an immediate and full withdrawal of troops from Syria. We will discuss the ramifications in tomorrow’s comment.
On Friday, December 14, we published our 2019 Outlook: Red Sky at Morning report. If you missed it, you can find the report linked here or on our website.
It’s Fed day! Equity markets are trying to rally this morning and oil prices are steady despite bearish API data. Here is what we are watching today:
The Fed: There are four likely outcomes from today’s meeting. Here is the lineup:
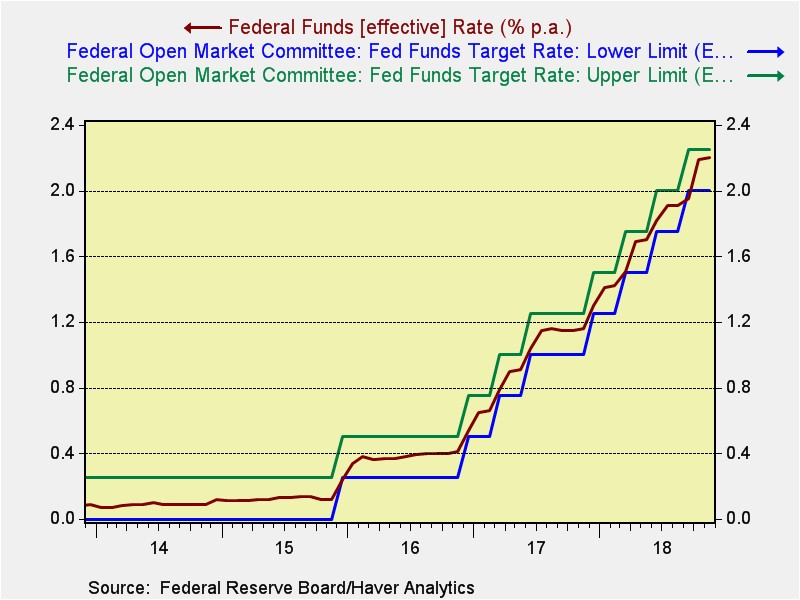
- The Fed hikes rates but signals a slowdown of the balance sheet reductions (most bullish for equities). Although the impact of the balance sheet remains in debate, market participants have begun to focus on the balance sheet and suggest it is tightening conditions more than expected. Here is why that idea is gaining traction—QE created a massive amount of excess reserves in the banking system. When the reserves were injected into the banking system, in reality, it was an asset swap. Banks gave up loans, commercial paper, bonds, etc., for cash. The cash stayed on balance sheets. But, to keep control of those reserves, the Fed started paying interest on reserves, something it hadn’t done in the past. The fed funds target used to be a single rate but in the wake of QE it is now a 25 bps range; that “rate” we talk about is really the upper bound. Thus, actual fed funds trade in a range between the upper and lower limit. However, as the chart below shows, the fed funds rate has been remarkably sticky at the upper end of the rate, so much so that the Fed has put a ceiling on the interest on reserves at 5 bps below the upper limit of fed funds. And, interestingly enough, the rate has been staying very close to that ceiling. This seems to show that there is some scarcity of reserves in the system, meaning banks would prefer to hold more reserves, perhaps for regulatory purposes or as a reaction to 2008, and thus are demanding the highest rate allowed. This has led some analysts to argue that the balance sheet reduction is “biting” much sooner than expected. However, it could also reflect a structural imbalance in the system, where large banks are awash in reserves but smaller banks are not and thus the larger banks are able to demand the highest rate on reserves. Therefore, a slowdown in “quantitative tightening” (QT) would be seen as very bullish.
- The Fed hikes and signals the cycle has ended (very bullish for equities). This doesn’t end the tightening, as the balance sheet would continue to contract, but it would be a clear signal that the Fed is trying to engineer a soft landing. This outcome is consistent with only one of the Mankiw Rule variations, the one using the employment/population ratio.
- The Fed hikes and signals a pause, but still shows at least one hike in 2019 (neutral to bullish for equities). This is the most likely outcome and is consistent with the uncertainty surrounding the neutral rate.
- The Fed hikes and signals no real change in policy path (bearish for equities). This outcome would essentially ignore warning signs from the financial markets and focus solely on the economy.
The highest probability outcome is #3, although we would not discount a fairly high probability of #2. Here’s why:
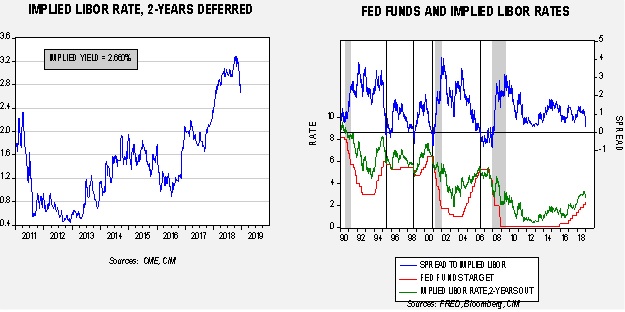
The chart on the left shows the implied three-month LIBOR rate, two-years deferred, from the Eurodollar futures market. Note how the rate has fallen sharply since peaking in late October (around the time Chair Powell said we were “a long way from neutral”). The chart on the right shows that this rate tends to act as a policy marker.[1] When the fed funds target is higher than the implied LIBOR rate shown on the right, the Fed tends to stop raising rates. Alan Greenspan was able to extend the 1991-2001 expansion by deftly adjusting to this implied LIBOR rate (there is no evidence that he actually used this rate in setting policy, but it is uncanny how close it was followed). The spread has narrowed from 125 bps in late September to 29 bps now, implying one hike after today. And, the implied LIBOR rate is falling rapidly, which could mean even that rate might be scuttled. The above chart should signal to the FOMC that they are close enough to neutral so as to pause.
So, stay tuned…
Italy makes a deal:Italy has come to a deal with the EU, averting the potential for a crisis.[2] This agreement reduces the odds of an immediate crisis but the underlying issues have not been resolved. Thus, we will revisit this issue again. But, for now, this is good news.
[1] We have assumed a 25 bps rate hike today in the spread calculation.
[2] https://www.ft.com/content/ca7a713e-037c-11e9-9d01-cd4d49afbbe3