

Daily Comment (December 17, 2018)
by Bill O’Grady and Thomas Wash
[Posted: 9:30 AM EDT] On Friday, December 14, we published our 2019 Outlook: Red Sky at Morning report. If you missed it, you can find the report linked here or on our website.
The big event this week is the FOMC meeting that ends on Wednesday. Equity markets continue to face pressure. Here are the details:
FOMC preview: There is great anticipation for Wednesday’s meeting. Financial markets are hoping for some indication that the Fed will pause after this hike and perhaps signal that it is closer to ending this tightening cycle. We note this morning that a former Fed governor and a prominent hedge fund manager are begging calling for the U.S. central bank to not only stop raising rates but to end balance sheet reduction as well.[1]
We do expect the FOMC will signal a potential pause by emphasizing its decisions are “data dependent” and will downplay forward guidance. Of course, that will make explaining the dots chart difficult. On that item, we would expect the FOMC to signal only two hikes next year.
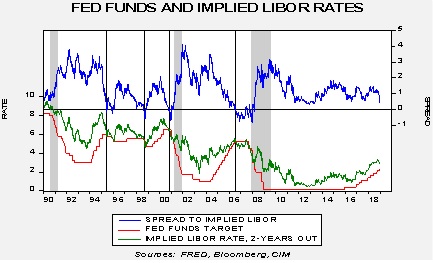
This chart shows fed funds against the implied three-month LIBOR rate from the two-year deferred contract in the Eurodollar futures market. In general, the Fed has tended to end tightening cycles when the two rates invert. We are assuming a 25 bps hike on Wednesday. This hike, coupled with a recent contraction in the implied rate, has led to a sharp narrowing of the spread. This chart would still imply two more rate increases of 25 bps next year. At the same time, it does indicate we are rapidly coming to the end of this tightening cycle. It’s also interesting to note that Yellen paused when the spread reached this level in 2016.
Next month we will have a new set of voting members for the FOMC.
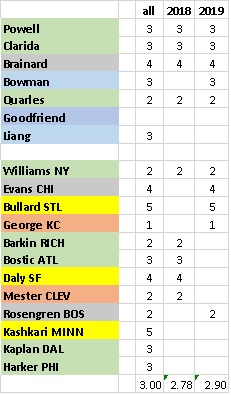
This is from our analysis of the various members of the FOMC; we rate them 1-5, with 1 being most hawkish and 5 most dovish. Governors are on top and always vote. We assume the governors will be a bit more dovish next year with the addition of Bowman. The average estimate for this year was 2.78 (anything < 3 leans hawkish); therefore, next year, we are looking for a modestly easier voting mix. The mix of Bullard and George will likely be an offset and they will mostly cancel each other out. Although Evans has traditionally been a dove, he has been calling for tighter policy recently to reduce financial speculation. Thus, he may be more hawkish than we are characterizing him. On the other hand, the flattening of the yield curve may have eased his concerns about excessive “froth” in the financial markets.
Overall, we expect the FOMC to follow expectations—look for a hike with a mostly dovish statement and press conference. If this doesn’t happen, we could see further weakness in the equity markets.
Equity markets: The S&P 500 has dipped back into correction territory as liquidation continues. Friday’s weakness didn’t have any particular catalyst; it was sort of a “Seinfeld” market.[2] There are rising worries about the economy and it is clear that international economies are coming under pressure. But, none of this is new; what has clearly changed is investor sentiment.
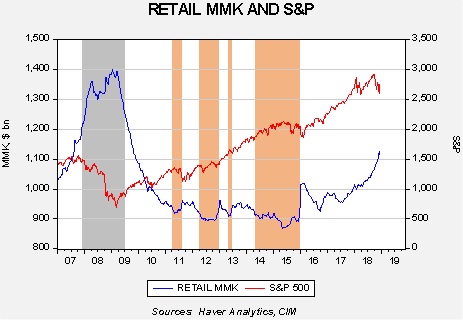
The blue line on the chart shows the level of cash held in retail money market funds, while the red line shows the S&P 500 (weekly close). The gray area shows the Great Recession; the orange areas show when retail money market funds fell below $920 bn. In this bull market, we note that when money market funds have fallen below $920 bn, the equity markets have tended to stall. It’s a bit like the equity markets ran out of liquidity and had to rebuild cash levels before making another advance. In 2007, and now, we saw a similar increase in money market funds. There is clearly an increasing preference for liquidity which is, in part, coming out of equities.
It is important to note that money market funds exceeded $1.3 trillion in 2008 and equities, though under pressure, were not in a free fall. From the peak to mid-summer, the S&P was off around 20%, a bear market but not a crash. And, we were in recession.[3] The real downdraft for equities occurred after the Lehman failure that exposed problems in the money market funds and in the derivative markets.
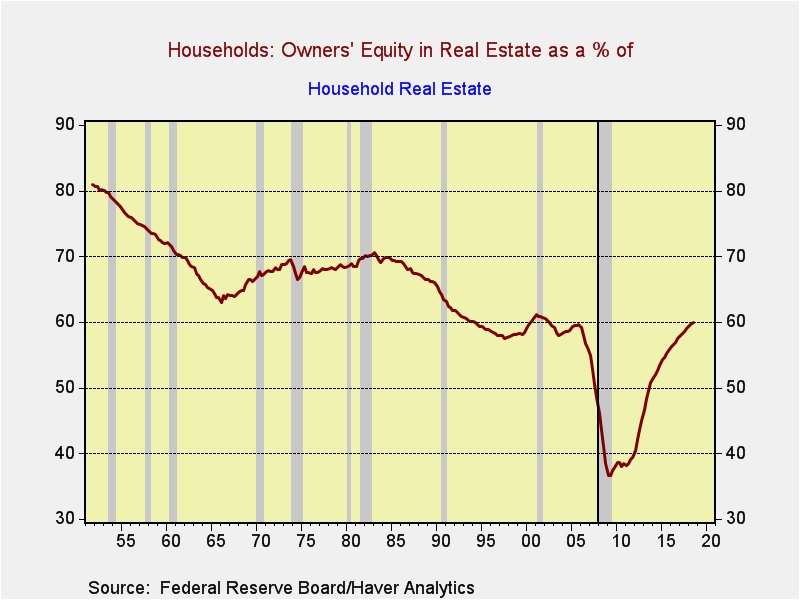
So, what does this chart tell us? First, the rapid accumulation of cash is important as it shows households are clearly worried about the future and want to hold more liquidity. Second, in 2007, when we saw a similar rise in liquidity, economic conditions were markedly worse. The housing market was imploding from a wildly overleveraged level. As the chart below shows, homeowners’ equity in their houses had fallen to 47% by the onset of the recession in Q4 2007; it is currently at 60%, which is essentially normal. And, as we noted above, there was clear evidence that a recession was underway.
It is important for investors to remember that the 2008 bear market was really a two-part event. The first was the 20% pullback driven by a “garden variety” recession; the second leg, which led to the full 40%+ decline, was a financial crisis. It is not unreasonable to fear another financial crisis but the odds are not all that high. Yes, there are areas of concern. Private equity has become rather frothy, for example. But, one of the major factors that led to the collapse in 2008 was the undermining of the money market funds. When important funds “broke the buck,” it led to panic. Although one can never say that such an event isn’t possible again, these events are rare and we don’t think it is in the cards.
Third, if a recession is avoided, the level of money market funds suggests ample liquidity and the potential for a strong equity recovery. Avoiding recession will take some luck and skill. The Fed will need to engineer that rarest of outcomes, the “soft landing.” Although one could argue that the Fed has made four soft landings in the past 60 years, in reality, it has only occurred twice as two of these events were due to exogenous factors. One occurred when the Fed lowered rates during Nixon’s wage/price freeze and the other occurred when the Fed dropped rates in 1985 when oil prices rolled over. Still, if the Fed does become data dependent going forward, the odds of a soft landing improve. The other issue is trade. Recession odds increase if the administration maintains a hard line on trade with China. Although we think that U.S. policy toward China is now hostile, we would not be shocked to see the administration go soft in 2019 to improve the odds of Trump’s reelection.
So, this is where we are. We are seeing a high degree of caution from investors, in part due to memories of 2007-09. This fear is completely understandable. However, it is important to note that conditions are quite different from that period and thus worries may be excessive. If we avoid recession in 2019, a rally in the S&P into the 2950/3000 area is reasonable.
Brexit: PM May is facing pressure to test different versions of Brexit in Parliament to see what will pass.[4] These could include a hard Brexit and a second referendum. May isn’t keen on the idea. First, a version of Brexit that would be acceptable to the MPs probably won’t pass the EU. Second, another referendum is fraught with risk. How the choices are listed on the ballot could swing the vote in unexpected ways. May has staked her political future on either the deal she negotiated or chaos. Thus, she is fighting against other deals. In reality, her plan won’t pass Parliament and the MPs likely believe that the EU will blink if faced with the choice between another plan more acceptable to the U.K. or a hard Brexit. That’s probably a mistake but this seems to be where we are heading…at least for today.
[1] https://www.wsj.com/articles/quantitative-tightening-not-now-11544991760 It is worth noting that Mr. Warsh’s policy stance used to be much more hawkish: https://www.cnbc.com/2017/10/03/kevin-warsh-would-take-a-hammer-to-the-fed-but-he-wouldnt-break-it.html
[2] https://www.youtube.com/watch?v=jUWiv5r_CZw
[3] Although, to be fair, the recession issue was a raging debate at the time. There were a number of economists who disputed the claim and in the August 2008 FOMC meeting transcripts policymakers were leaning toward starting rate hikes in the autumn, fearing they had overreacted to the problems in financial markets earlier in the year. It should be noted, however, that most of our indicators were in recession territory; for example, the Chicago National Activity Index, even on a six-month average, signaled recession by January 2008 and the unemployment rate compared to its rate two years earlier had inverted by December 2007.
[4] https://www.ft.com/content/8e240890-0119-11e9-99df-6183d3002ee1