

Daily Comment (April 5, 2018)
by Bill O’Grady and Thomas Wash
[Posted: 9:30 AM EDT] Equities rebounded strongly yesterday after an opening sell-off. So far, U.S. stocks are building on yesterday’s gains. Here is what we are watching this morning:
As a point of reference: We have a weekly chart on the S&P 500 P/E ratio at the end of this report. The methodology of our calculation is explained in the footnote but, essentially, we try to create a multiple that avoids the pure backward-looking problems of a trailing P/E and the worst of the “fantasy” of a pure forward-earning estimate. With the onset of Q2, the P/E has dropped 2x. The combination of strong earnings and the recent price correction has reduced some of the valuation concerns. Continued economic growth and the impact of the tax bill on earnings should support continued robust earnings growth.
The key worry remains inflation. Inflation volatility does affect the P/E.
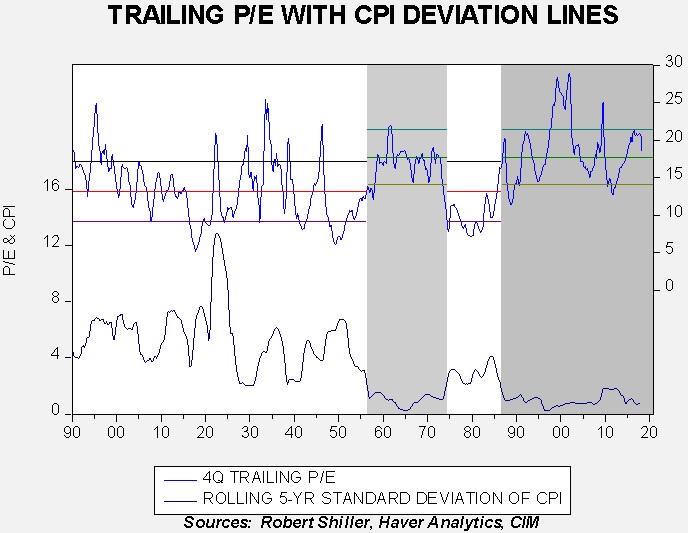
This is a near replica of the chart at the end of this report but we have added two periods with gray bars and created averages and standard deviation lines for these periods. The lower line on the chart shows the five-year rolling standard deviation of CPI. During periods of low inflation volatility, the multiple tends to expand. Based on the assumption that inflation volatility will remain less than 2% (what we see in the gray areas), the current multiple isn’t excessive.
This is partly why the trade turmoil is causing such market volatility. Since the 1980s, the trade deficit has clearly dampened inflation. This is the impact of globalization. Backing away from free trade carries the potential to boost price levels and raise inflation volatility. The real concern is if inflation volatility rises to levels seen outside the gray areas on the above chart; a reset of the P/E would be expected to follow. In periods with higher inflation volatility, the P/E averages 13.1x. In periods of low volatility, it averages 17.7x. The reset creates extended bear market conditions. So far, we remain in the gray band, which is favorable for equities. Nevertheless, trade war worries are legitimate and inflation volatility is the key metric.
Lula looks finished: Former Brazilian President Lula had been a candidate for a return to office. However, the Brazilian Supreme Court has ruled that the former president should face jail time for his corruption conviction. Lula was involved in the widespread “Lava Jato”[1] scandal and convicted of receiving bribes. Lula maintains his innocence; apparently, the Supreme Court disagrees. With this decision, the October presidential election is up for grabs. Polling showed Lula as the most popular candidate but this ruling likely ends any chances he will be eligible to run. Thus, the potential for political and market volatility will increase as the elections approach.
A new Plaza? The 1985 Plaza Accord led to a massive downtrend in an overvalued dollar in a bid to bring down the trade deficit. So far, the Trump administration has mostly avoided currency manipulation as a threat or tool in trade negotiations. However, that strategy may change. In the next few weeks, the Treasury is expected to produce its semi-annual update on exchange rates. The report determines whether an exchange rate is being manipulated in such a way as to build a trade advantage. In practice, this report usually perpetuates the fiction that no nation is engaging in such currency policies, although, like gambling at Rick’s American Café, everyone knows it’s going on. There is growing speculation that the president will discover the power of forex pressure. The recent new trade deal with South Korea included a side agreement to end the country’s rather blatant currency manipulation. We would not be shocked to see the administration begin talking down the dollar. We bolded the word “mostly” above because Treasury Secretary Mnuchin noted at Davos that a weaker dollar would aid in lowering the trade deficit. The president recoiled at the term “weak dollar” but if he can be schooled on the idea that a weaker dollar is good for trade then it would make sense to use exchange policy to achieve this aim. The market outcome would be to further support foreign investing for dollar-based investors. It should also help precious metals.
Energy recap: U.S. crude oil inventories fell 4.6 mb compared to market expectations of a 2.0 mb build.
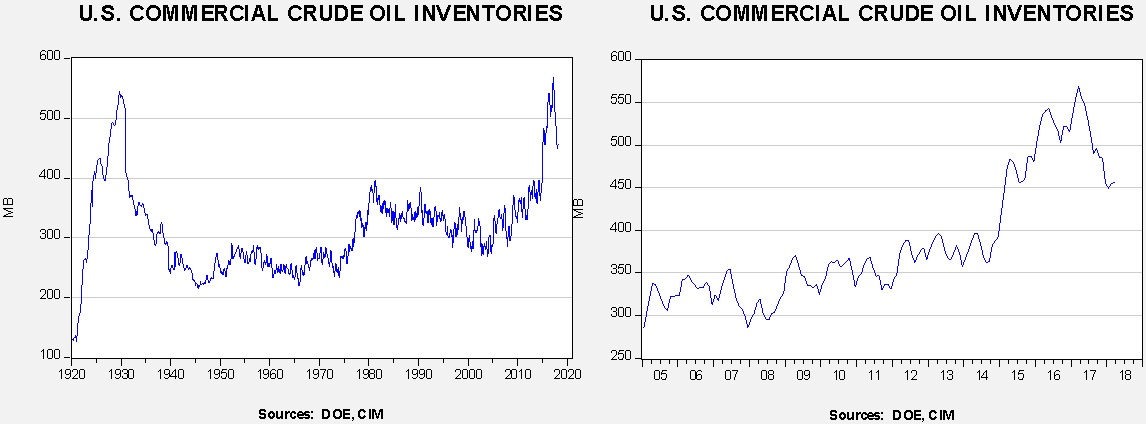
This chart shows current crude oil inventories, both over the long term and the last decade. We have added the estimated level of lease stocks to maintain the consistency of the data. As the chart shows, inventories remain historically high but have declined significantly since last March. We would consider the overhang closed if stocks fall under 400 mb.
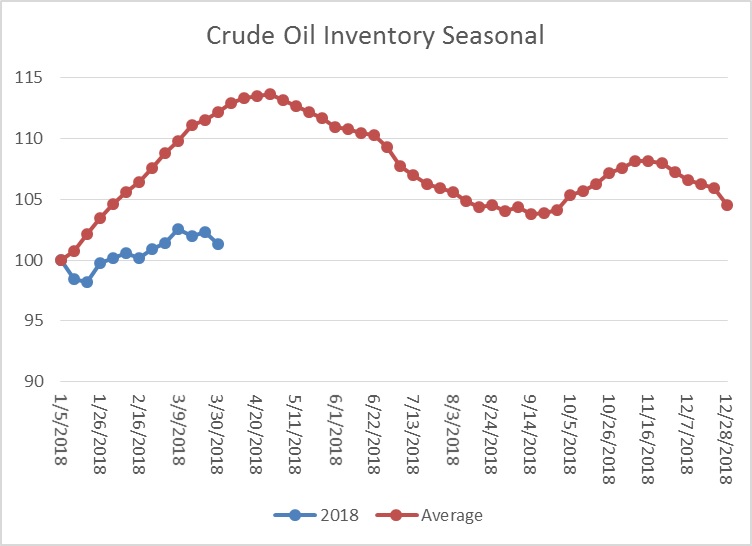
As the seasonal chart below shows, inventories are usually rising this time of year. This week’s decline in stockpiles was unusual and is bullish for prices. Every week that fails to show a build on the seasonal pattern is a week in which the seasonal factors become less bearish. While there is still time for stockpiles to rise, it is unlikely they will reach their seasonal norms.
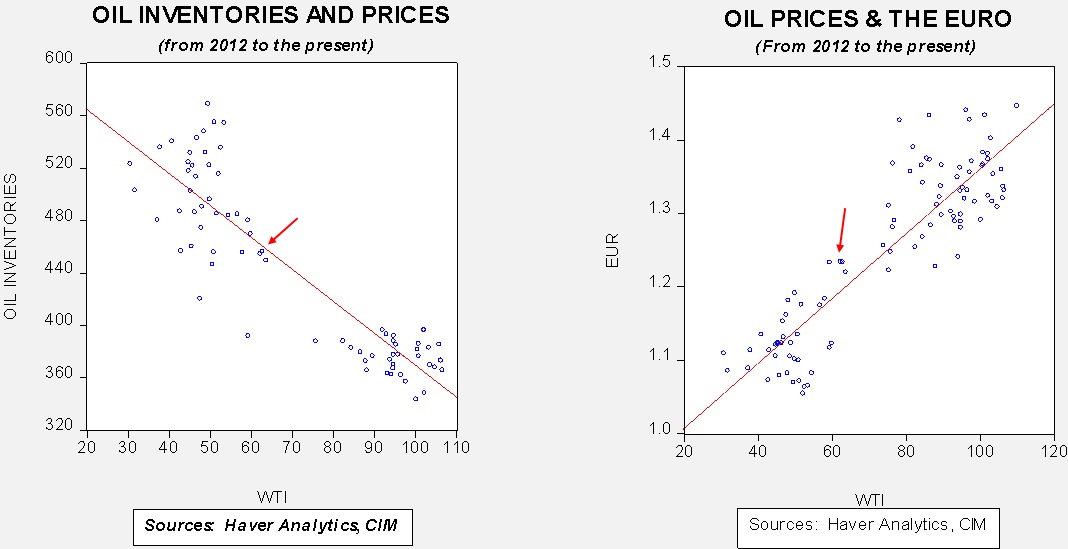
Based on inventories alone, oil prices are undervalued with the fair value price of $65.74. Meanwhile, the EUR/WTI model generates a fair value of $74.94. Together (which is a more sound methodology), fair value is $71.98, meaning that current prices are below fair value. Oil prices remain range-bound but should move higher by early summer when the driving season begins.
[1] Car Wash