

Daily Comment (April 12, 2018)
by Bill O’Grady and Thomas Wash
[Posted: 9:30 AM EDT] It was a fairly quiet overnight session; the dollar reversed some of yesterday’s losses and equities are modestly higher. This is what we are watching:
Ryan’s departure: Soon after last November’s elections, we framed the forthcoming political battle as “Ryan vs. Bannon.” Now, both are gone. Bannon was banished from the White House last summer and Speaker Ryan confirmed what had been rumored for some time that he isn’t going to run again. Last November, our position was that President Trump wasn’t necessarily fully formed as a political figure and that the establishment (Ryan) and the populists (Bannon) were trying to get control of the president’s agenda. Both figures are now gone because the president has established his political persona. Trump isn’t as populist as Bannon had hoped—it’s important to remember that Bannon wanted to raise the highest marginal tax rate on households above 40% while cutting rates to lower income households. Trump is too much within the establishment to sponsor that idea. At the same time, trade policy, the growing fiscal deficits and Trump’s continued support for universal social spending (Social Security, Medicare) has made it clear to Ryan that his style of conservatism is no longer ascendant. Thus, there is no reason for Ryan to remain as Speaker.
As we have noted before, our two-party system is really a form of forced coalitions and there are periods when the coalition groups within the parties are in flux. This is one of those moments. We don’t know for sure where all the various groups will eventually align but we strongly suspect that groups we currently think of as Republicans or Democrats won’t be the same in 10 years.
A walk back: Yesterday, President Trump caused quite a stir by suggesting an attack on Syria was imminent and warning Russia that missiles were coming. This was something of a mistake; the military always prefers an element of surprise and tweeting about an incoming attack is counterproductive. So, this morning, the president reintroduced an element of surprise by suggesting an attack may not happen at all (very unlikely) or will occur at some unknown date. There are two things we are watching. We expect an escalation from last year’s limited cruise missile strike which means (a) the U.S. needs more military assets in theater, and (b) the U.S. would prefer allies involved in this action. The U.K. is considering joining the U.S. and we would expect France, which has long-standing ties to Syria, to also participate. We would also anticipate at least some token participation by the Gulf Kingdoms. On the first point, the U.S.S. Harry S. Truman has left port in Norfolk after extensive maintenance and training for the Fifth Fleet’s Area of Operations, which includes the Middle East. Assuming it can reach the Mediterranean in 10-14 days, we suspect nothing major will happen before then. Second, it will take some time to gather allies and coordinate a plan. Thus, we still expect a military strike but not imminently.
A comment on equities: Whenever we have a period of equity market weakness, there are always concerns that equities are signaling economic weakness and a bear market is in the offing. Our economic data indicator, which uses initial claims, commodity prices and consumer confidence, would suggest we are in a period of correction and consolidation but does not indicate an ensuing bear market.
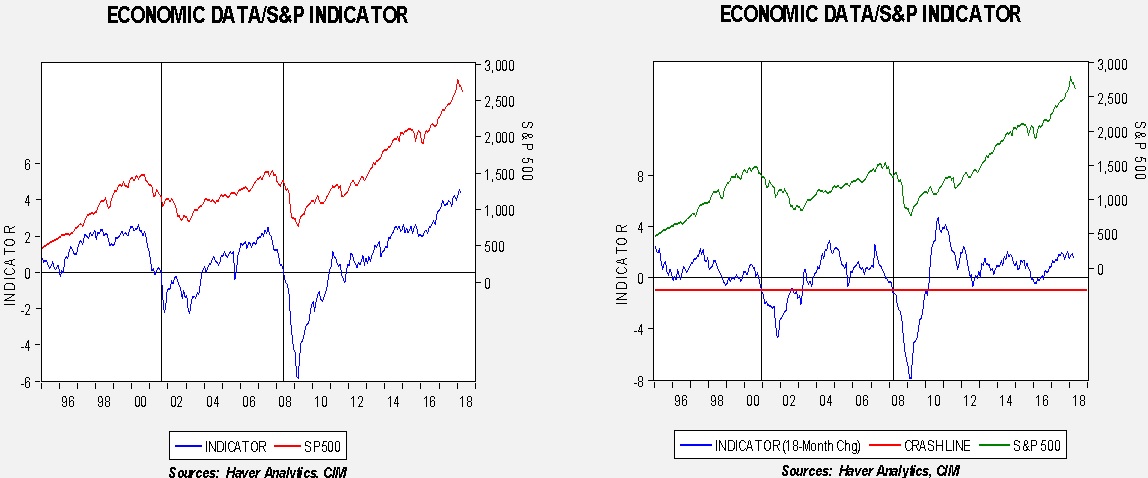
The chart on the left shows the S&P 500 with our economic data indicator. The indicator is constructed by normalizing the aforementioned economic data and creating an index. The left chart shows the raw index; when it crosses zero, it indicates economic weakness and signals further weakness in equities. However, it is somewhat “slow”; to correct this deficiency, we use the 18-month change in the indicator and the warning signal is when it crosses the red line, shown on the right chart. This gives an earlier warning but avoids the false positives of a mere zero crossing. As the charts indicate, there is no obvious danger coming from the high frequency data.
There are two caveats. First, there is the usual “past performance doesn’t guarantee future performance” warning. The second is that this is an economic model and should not be expected to signal warnings for geopolitical or political crises.
Energy recap: U.S. crude oil inventories rose 3.3 mb compared to market expectations of a 1.3 mb draw.
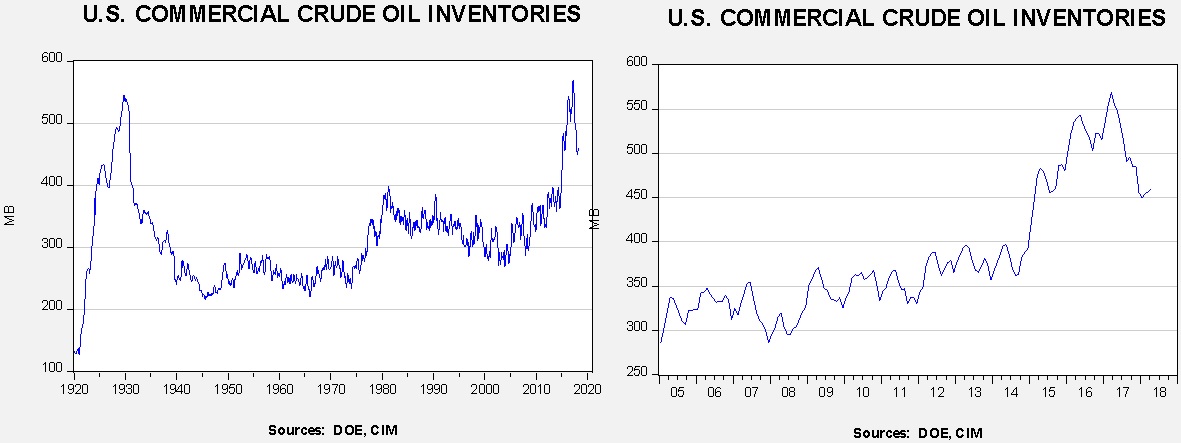
This chart shows current crude oil inventories, both over the long term and the last decade. We have added the estimated level of lease stocks to maintain the consistency of the data. As the chart shows, inventories remain historically high but have declined significantly since last March. We would consider the overhang closed if stocks fall under 400 mb.
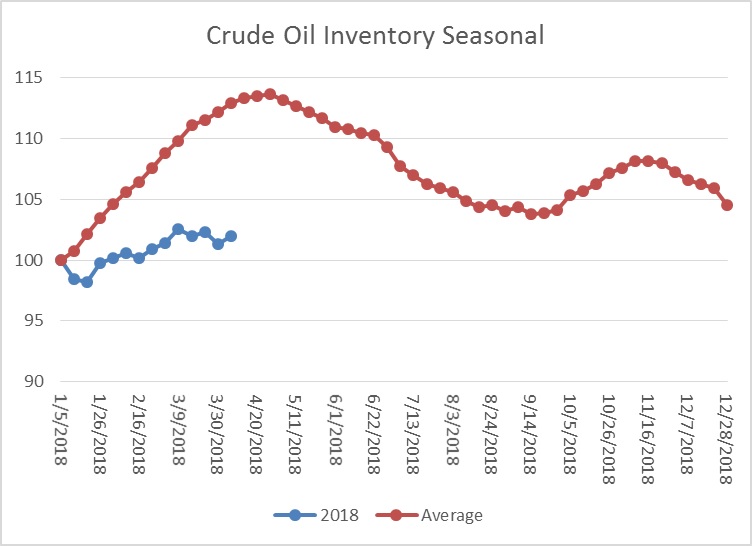
As the seasonal chart below shows, inventories are usually rising this time of year. This week’s rise in stockpiles is normal. Every week that fails to show a build on the seasonal pattern is a week where the seasonal factors become less bearish. Although there is still time for stockpiles to rise, it will be virtually impossible for inventories to reach their seasonal norms.
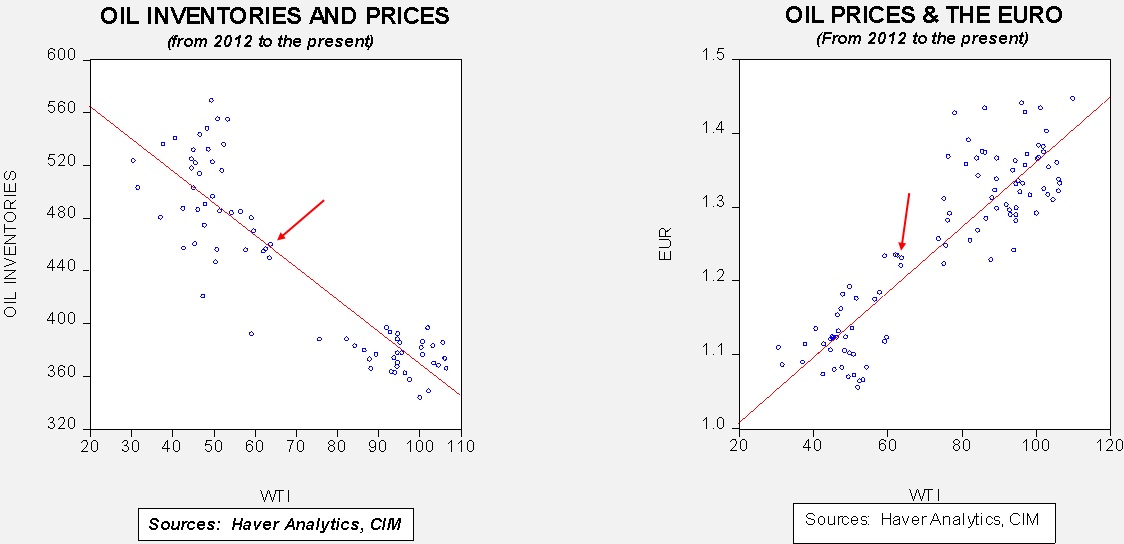
Based on inventories alone, oil prices are undervalued with the fair value price of $64.54. Meanwhile, the EUR/WTI model generates a fair value of $74.08. Together (which is a more sound methodology), fair value is $70.92, meaning that current prices are below fair value. Oil prices have been rising on geopolitical tensions but it should be noted that current inventory levels are supportive, as is the weak dollar. If tensions remain high, the seasonal “flip” that will occur by early May will add to potential market strength.