

Business Cycle Report (May 29, 2025)
by Thomas Wash | PDF
The business cycle has a major impact on financial markets; recessions usually accompany bear markets in equities. The intention of this report is to keep our readers apprised of the potential for recession, updated on a monthly basis. Although it isn’t the final word on our views about recession, it is part of our process in signaling the potential for a downturn.
In April, the US economy continued to grow broadly with no immediate signs of contraction. The composite economic index remained just above the recession threshold and showed minimal change from the previous month’s reading. While employment indicators continued to demonstrate resilience, other sectors presented a more nuanced picture. Financial markets and real economic data sent mixed signals, suggesting an economy at a crossroads between sustained growth and potential softening. This dichotomy between strong labor markets and weaker production indicators bears close monitoring in coming months.
Labor Market
The labor market showed gradual easing from its recent peaks while remaining tight by historical standards. Initial jobless claims and employer payrolls pointed to ongoing strength in the demand for labor. In contrast, the two-year change in the unemployment rate signaled potential weakness. This divergence suggests that while hiring may be cooling from its torrid post-pandemic pace, underlying demand for workers remains robust. The continued labor market tightness provides an important buffer against broader economic weakness, supporting consumer spending and overall growth.
Financial Markets
Financial markets delivered conflicting messages about economic prospects. Equity markets rallied on optimism that potential trade restrictions might be less severe than initially anticipated, reflecting confidence in corporate earnings. However, bond markets told a more cautious story, with Treasury yields ending the month slightly lower as investors priced in greater economic uncertainty. This disconnect between equity and fixed income markets typically signals investor debate about future growth trajectories, with bond markets often proving more prescient about economic turning points.
Goods Production and Sentiment
The goods-producing sector emerged as the economy’s weakest link in April, with three of four key diffusion indicators in contraction territory. Consumer sentiment remained depressed, potentially foreshadowing softer spending ahead. Business investment showed particular weakness, evidenced by sluggish housing starts and declining capital expenditures. These trends suggest corporate leaders are growing more cautious about future demand. However, supplier delivery times — often an early indicator of economic activity — remained elevated, pointing to persistent underlying demand that could support continued expansion.
Outlook and Risks
While recession risks persist, current data suggests the economy will likely avoid contraction in the near term. The primary uncertainties center on potential trade policy impacts and whether labor market strength can offset softness elsewhere. There are signs of growing margin pressures that could eventually affect hiring and investment decisions. Our baseline projection anticipates continued modest growth through the third quarter, though the economy appears increasingly vulnerable to external shocks. Investors should remain vigilant for signs of broader economic deterioration, while increasing risk exposure may be warranted as the economic outlook becomes clearer.
The Confluence Diffusion Index for May, which encompasses data for April, remained slightly above the recovery indicator. However, the report showed that five out of 11 benchmarks are in contraction territory. Using April data, the diffusion index was unchanged at -0.0909 and above the recovery signal of -0.1000.
- Equity prices bounced back following trade progress.
- Manufacturing data offered mixed signals.
- Hiring picked up in a sign that labor conditions remain tight.
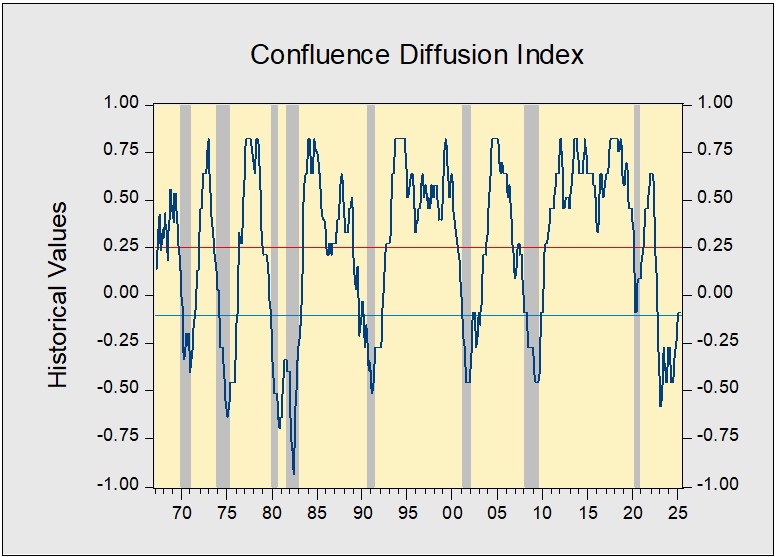
The chart above shows the Confluence Diffusion Index. It uses a three-month moving average of 11 leading indicators to track the state of the business cycle. The red line signals when the business cycle is headed toward a contraction, while the blue line signals when the business cycle is in recovery. The diffusion index currently provides about six months of lead time for a contraction and five months of lead time for recovery. Continue reading for an in-depth understanding of how the indicators are performing. At the end of the report, the Glossary of Charts describes each chart and its measures. In addition, a chart title listed in red indicates that the index is signaling recession.