

Business Cycle Report (June 26, 2025)
by Thomas Wash | PDF
The business cycle has a major impact on financial markets; recessions usually accompany bear markets in equities. The intention of this report is to keep our readers apprised of the potential for recession, updated on a monthly basis. Although it isn’t the final word on our views about recession, it is part of our process in signaling the potential for a downturn.
The US economy extended its expansion in May, with the composite economic index remaining above contraction territory for the fourth consecutive month. While financial conditions broadly improved, the goods-producing sector sent mixed signals and the labor market showed tentative signs of softening. Against a backdrop of lingering tariff uncertainty, we are closely monitoring labor market conditions and goods production for early indicators of economic stress.
Financial Markets
Investors largely shrugged off trade tensions amid progress in negotiations with China, the UK, and India. Optimism that tariffs may not escalate further buoyed risk sentiment, fueling rallies in major tech stocks. Meanwhile, rising sovereign debt concerns in developed markets pushed long-term Treasury yields higher, steepening the yield curve. As a result, the financial spread moved into positive territory for the first time in three months — a potential signal of improving growth and inflation expectations.
Goods Production & Sentiment
The goods-producing sector was the economy’s softest segment in May, with three of the four key diffusion indicators in contraction. Consumer sentiment remained subdued due to persistent inflation expectations and tariff uncertainty. Housing construction slowed under pressure from elevated interest rates and rising material costs. While a proxy for investment spending improved slightly, it remained in contraction territory. Business surveys indicated lingering supply chain pressures, with slow delivery times suggesting a sustained demand for factory goods.
Labor Market
The labor market continued to moderate but remains robust by historical standards. The unemployment rate held steady at 4.2%, suggesting that while labor conditions have eased from their peak, they remain tight. However, initial jobless claims rose noticeably and payroll growth slowed in May, both early signs that employers may be scaling back hiring. For now, the data does not yet warrant policy intervention, but further softening could shift the Fed’s outlook.
Outlook & Risks
The economy continues to demonstrate resilience, supported by steady consumer and business spending. However, much of this strength may reflect drawdowns of pre-tariff inventory stockpiles. While we do not anticipate a near-term recession, the critical question is whether firms can absorb higher tariff costs through compressed margins or would they be able to pass them on to consumers without stifling demand. The coming months will test the economy’s ability to adapt to these persistent headwinds, but we still think this remains a good time to increase risk exposure.
The Confluence Diffusion Index for June, which encompasses data for May, remained slightly above the recovery indicator. However, the report showed that four out of 11 benchmarks are in contraction territory. Using May data, the diffusion index improved to -0.0303, above the recovery signal of -0.1000.
- Stocks gained momentum as progress in trade negotiations boosted investor sentiment.
- Rising input costs continue to weigh on the manufacturing sector.
- A noticeable uptick in jobless claims points to a potential softening in the labor market.
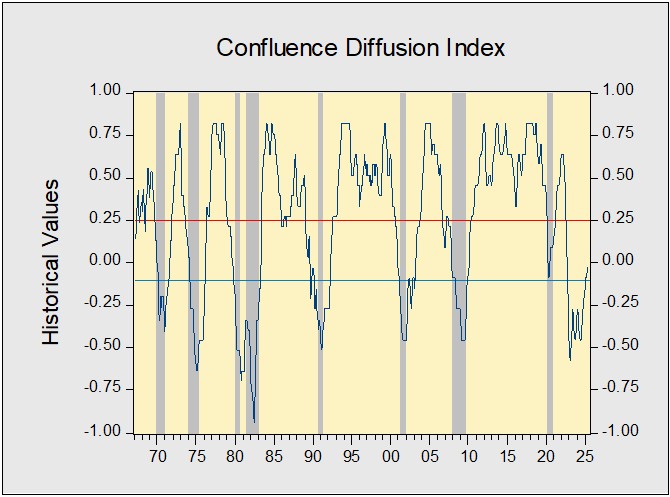
The chart above shows the Confluence Diffusion Index. It uses a three-month moving average of 11 leading indicators to track the state of the business cycle. The red line signals when the business cycle is headed toward a contraction, while the blue line signals when the business cycle is in recovery. The diffusion index currently provides about six months of lead time for a contraction and five months of lead time for recovery. Continue reading for an in-depth understanding of how the indicators are performing. At the end of the report, the Glossary of Charts describes each chart and its measures. In addition, a chart title listed in red indicates that the index is signaling recession.