

Business Cycle Report (March 26, 2020)
by Thomas Wash
The business cycle has a major impact on financial markets; recessions usually accompany bear markets in equities. We have created this report to keep our readers apprised of the potential for recession, which we plan to update on a monthly basis. Although it isn’t the final word on our views about recession, it is part of our process in signaling the potential for a downturn.
In February, the economic data was slightly weaker than the prior month but not enough to signal recession. The coronavirus spread from China into South Korea, which raised concerns of the impact the virus would have on the global economy. As a result, equities weakened and U.S. Treasuries rallied. That being said, manufacturing showed signs of a recovery as purchasing managers were optimistic that the trade deal signed in the previous month would finally lead to an improvement in orders. Additionally, the employment numbers were strong, suggesting that prior to March there was a lot of optimism about the economy. In this report, three out of the 11 indicators were in recession territory. The reading for February fell to +0.576 from +0.636.
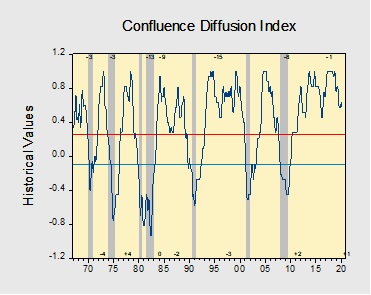
The chart above shows the Confluence Diffusion Index. It uses a three-month moving average of 11 leading indicators to track the state of the business cycle. The red line signals when the business cycle is headed toward a contraction, while the blue line signals when the business cycle is headed toward a recovery. On average, the diffusion index is currently providing about six months of lead time for a contraction and five months of lead time for a recovery. Continue reading for a more in-depth understanding of how the indicators are performing and refer to our Glossary of Charts at the back of this report for a description of each chart and what it measures. A chart title listed in red indicates that indicator is signaling recession.