

Business Cycle Report (August 27, 2020)
by Thomas Wash | PDF
The business cycle has a major impact on financial markets; recessions usually accompany bear markets in equities. The intention of this report is to keep our readers apprised of the potential for recession, updated on a monthly basis. Although it isn’t the final word on our views about recession, it is part of our process in signaling the potential for a downturn.
In July, the diffusion index surged into recovery territory signaling that the economy may be on track to grow in Q3. Financial markets were sending mixed signals as equities surged while the yield curve flattened. Meanwhile, the labor market showed signs of improvement as firms hired workers in record numbers. Firms were likely optimistic about the economy as the month saw an increase in consumption resulting from the reduction in lockdown restrictions. However, economic uncertainty has weighed on consumer and investor confidence as a rise in virus cases has hindered efforts to further ease restrictions. As a result, five out of the 11 indicators are in contraction territory. The reading for July rose from -0.1515 to -0.0303, above the recovery signal of -0.100.
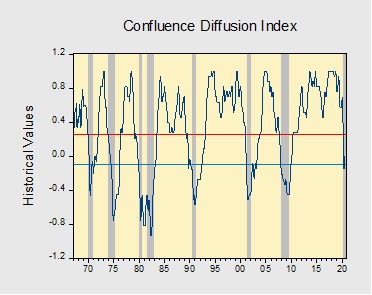
The chart above shows the Confluence Diffusion Index. It uses a three-month moving average of 11 leading indicators to track the state of the business cycle. The red line signals when the business cycle is headed toward a contraction, while the blue line signals when the business cycle is headed toward a recovery. On average, the diffusion index is currently providing about six months of lead time for a contraction and five months of lead time for a recovery. Continue reading for a more in-depth understanding of how the indicators are performing and refer to our Glossary of Charts at the back of this report for a description of each chart and what it measures. A chart title listed in red indicates that indicator is signaling recession.