

Business Cycle Report (April 23, 2020)
by Thomas Wash
The business cycle has a major impact on financial markets; recessions usually accompany bear markets in equities. We have created this report to keep our readers apprised of the potential for recession, which we plan to update on a monthly basis. Although it isn’t the final word on our views about recession, it is part of our process in signaling the potential for a downturn.
In March, the diffusion index nearly fell into recession territory. The weakness in the report was primarily due to the coronavirus pandemic, turmoil in the financial markets and the Saudi-Russia oil dispute. Last month, confirmed cases of COVID-19 in the U.S. rose from 74 at the start of the month and grew to over 180,000. Meanwhile, the oil price war between Saudi Arabia and Russia led oil prices to fall to a near-20-year low. As a result, equities dropped and Treasuries rallied. The interest rate on the 10-year T-note fell below 1.0% for the first time ever. Additionally, the manufacturing sector showed mixed signals as a slowdown in delivery times reflected positively in the report despite a drop in new durable goods orders. The employment numbers were abysmal and will likely be worse in next month’s report. In this report, six out of the 11 indicators were in recession territory. The reading for March fell to +0.333 from +0.57, a hair above the recession signal of +0.250.
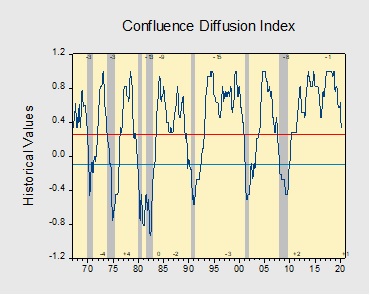
The chart above shows the Confluence Diffusion Index. It uses a three-month moving average of 11 leading indicators to track the state of the business cycle. The red line signals when the business cycle is headed toward a contraction, while the blue line signals when the business cycle is headed toward a recovery. On average, the diffusion index is currently providing about six months of lead time for a contraction and five months of lead time for a recovery. Continue reading for a more in-depth understanding of how the indicators are performing and refer to our Glossary of Charts at the back of this report for a description of each chart and what it measures. A chart title listed in red indicates that indicator is signaling recession.