

Asset Allocation Weekly (September 6, 2019)
by Asset Allocation Committee
In 2017, we introduced an indicator of the basic health of the economy and added it to the many charts we monitor to gauge market conditions. The indicator is constructed using commodity prices, initial claims and consumer confidence. The thesis behind this indicator is that these three components should offer a simple and clear picture of the economy; in other words, rising initial claims coupled with falling commodity prices and consumer confidence is a warning that a downturn may be imminent. The opposite condition should support further economic recovery. In this report, we will update the indicator with August data.
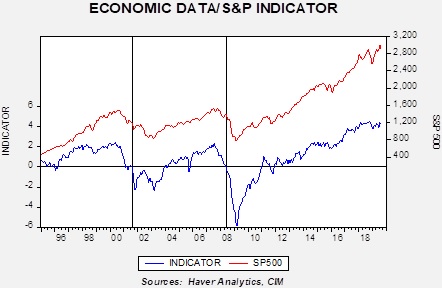
This chart shows the results of the indicator and the S&P 500 since 1995. The updated chart shows that the economy did slip late last year but has stabilized in 2019. We have placed vertical lines at certain points when the indicator fell below zero. It works fairly well as a signal that equities are turning lower, but there is a lag. In other words, by the time this indicator suggests the economy is in trouble, the recession is likely near or already underway and the equity markets have already begun their decline.
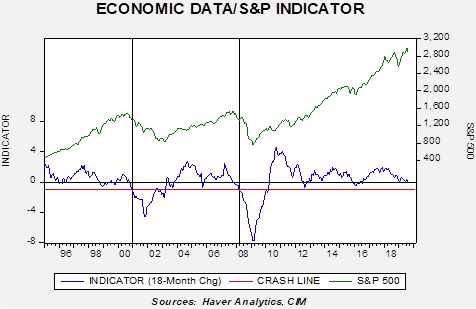
To make the indicator more sensitive, we took the 18-month change and put the signal threshold at minus 1.0. This provides an earlier bearish signal and also eliminates the false positives that the zero threshold generates. At the same time, the fact that this variation of the indicator is just below zero raises caution.
What does the indicator say now? The economy has decelerated but is not yet at a point where investors should become defensive. Breaking below the red line would be our signal to expect a broader downturn. As we have noted over the past two weeks, other indicators have signaled rising odds of recession. We continue to monitor conditions closely but, as noted above, it is still too early to shift portfolios into a fully defensive stance.