

Asset Allocation Weekly (September 4, 2020)
by Asset Allocation Committee | PDF
(NB: Due to the Labor Day holiday, the next report will be published on September 18.)
The U.S. economy is driven primarily by consumer spending. In 2019, for example, personal consumption expenditures on goods and services accounted for 67.9% of U.S. gross domestic product (GDP). For the economy to grow, consumers simply must boost their spending. But what allows consumers to do that? Generally, consumers need to fund their spending out of income, so one key to sustained growth in consumer spending is sustained growth in consumers’ income. The Commerce Department tracks the total volume of personal income in the economy, including wages and salaries (the large majority of income). It also counts proprietors’ income, dividends, interest, rent, and the like.
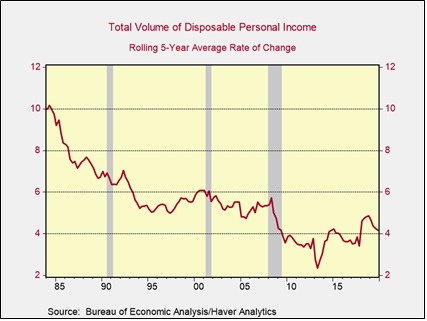
The problem is not all that income is available to be spent. As the saying goes, there is nothing certain in life but death and taxes. Since one can’t easily avoid paying the government’s take, economists typically focus on personal income after taxes, commonly referred to as “disposable income.” The graph below shows how the total volume of disposable income has grown at a slower and slower rate for most of the time since the mid-1980s. The slowdown reflects many factors, such as slower population growth, globalization, declining inflation, and changing tax policy. The slowdown in disposable income growth goes far toward explaining why U.S. economic growth has moderated over the last few decades.
We think it’s also useful to dive a bit deeper into the personal income story. Note, for example, that once a person takes on debt, they have an obligation to make debt service, i.e., interest and principal payments. That debt service might not be as hard to avoid as taxes but getting out of the obligation is onerous. Debt service limits how much discretion people really have over their spending, so we pay close attention to a measure that we think is a better gauge of truly discretionary income. Our measure consists of disposable income less debt service (in other words, total personal income after paying taxes, interest, and principal). To better approximate how discretionary income has grown from the perspective of an individual, we calculate it on a per-capita basis. In the chart below, the red line shows the rolling five-year rate of change in per-capita discretionary income based on our calculations.
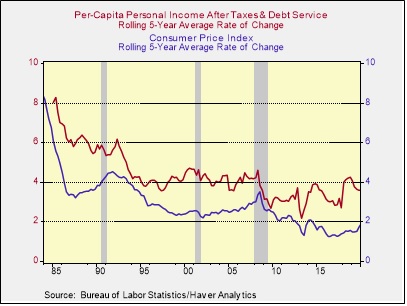
Rising prices can take a bite out of people’s purchasing power, so we also compare how our measure of income has changed versus the consumer price index (CPI), which is shown by the blue line in the chart. Over the period shown in the chart, per-capita discretionary income has grown by an average of 1.56% over the rate of inflation. When the gap narrows—because of slowing income growth, accelerating inflation, or both—recessions often follow. More broadly, the big story here is that since the late 1980s, when per-capita discretionary income was growing almost 3% faster than consumer prices, income growth has generally exceeded inflation by a much narrower margin. Much of the reason was the dramatic rise in household debt and debt service as consumers struggled to maintain their lifestyles during the 1990s and early 2000s. In the midst of the Great Financial Crisis of 2008-2009, consumers were saddled with all the mortgage debt they took on during the housing boom, so the growth in per-capita discretionary income barely exceeded inflation at all. The disparity remained weak in the years immediately following the crisis until consumers were able to work down their debt.
The good news is that discretionary income accelerated far beyond inflation in the late 2010s. In the five years ended in December 2018, per-capita discretionary income grew at a rate 2.69% higher than CPI inflation, almost matching the best figure in the late 1980s and reflecting improved wage and salary growth, falling debt service costs, tax cuts, and stagnating population growth. Consumer finances looked very good before the coronavirus hit. Now, however, the pandemic is seriously pushing down income, and many people may take on increased debt to tide them over. That means that even if prices fall a bit more or remain stable, the disparity of discretionary income over inflation could weaken again and discourage spending growth.