

Asset Allocation Weekly (September 13, 2019)
by Asset Allocation Committee
In recent reports, we have discussed the yield curve and its value in signaling the business cycle. One of the problems for investors with using the various permutations of the yield curve as a signaling device is that it gives such early warnings that it may not be all that useful.
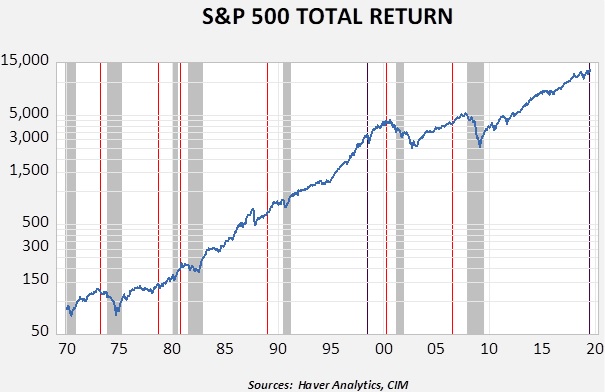
This chart shows the total return for the S&P 500; the vertical lines denote the inversions of the yield curve. The red lines represent when the inversion preceded a recession. The black lines are inversions that resulted in false positives.[1] The data shows that exiting equities at the point of inversion would, in several cases, be premature. It might make sense to reduce equity exposure, but a complete retreat would not be warranted.
Labor market signals of recession tend to occur at or just before a downturn, but they also give us insight into when a recession may be imminent. There are two indicators we like. The first is the rolling 12-month sum of the monthly change in non-farm payrolls. A reading of 1.5 million jobs is the indicator; falling below that level means a recession is near or underway.
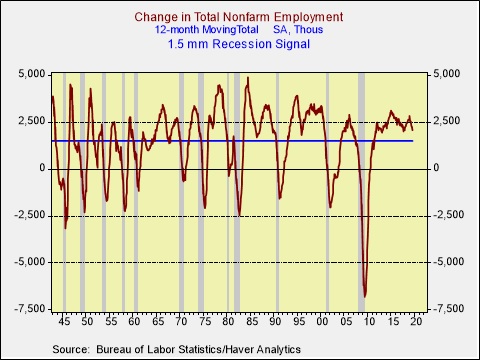
The current reading is 2.074 mm, meaning payrolls remain in expansion mode. The second indicator is the two-year change in the unemployment rate.
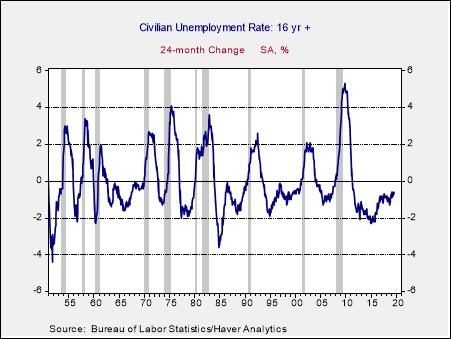
The current unemployment rate is 3.7%; in August 2017, it was 4.4%, meaning we still haven’t triggered a recession signal. If the unemployment rate remains stable, we could be close to a recession signal in September 2020.
The labor market data suggests a recession isn’t imminent, meaning investors should avoid becoming overly defensive at this juncture. That doesn’t mean one should not be watchful, but overreacting to the yield curve would be imprudent for most investors.
[1] We are treating the current inversion as a false positive until proven otherwise.