

Asset Allocation Weekly (October 4, 2019)
by Asset Allocation Committee
Although the convention for measuring earnings is compared to shares, Standard and Poor’s also calculates the level of operating earnings for all the stocks in the S&P 500.
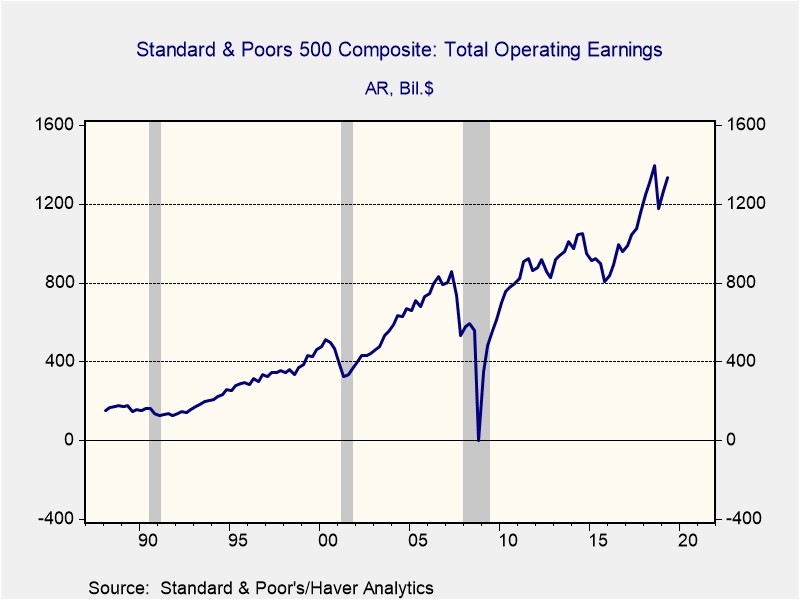
The per-share value is calculated by dividing this number by the S&P divisor. The advantage of this number versus the per-share data is that it is easier to compare total operating earnings of the S&P to the profits data compiled by the Bureau of Economic Analysis (BEA) as part of the National Product Account data.[1] The BEA data measures total corporate profitability.
The BEA makes occasional revisions to the GDP and related reports, and recently we had a significant revision to the profits calculation.
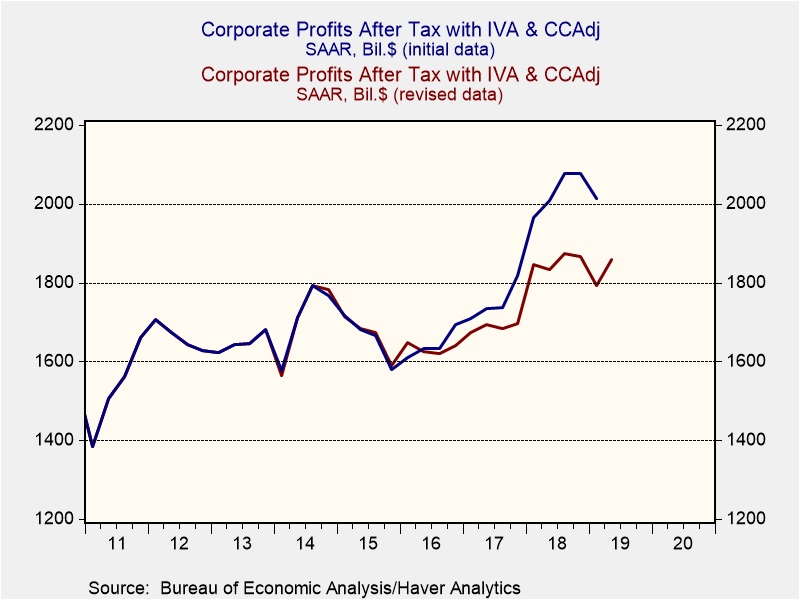
The BEA made a meaningful revision to its profit calculation.[2] We use this data and forecasts from the Survey of Economists conducted by the Philadelphia FRB in calculating our earnings forecast.
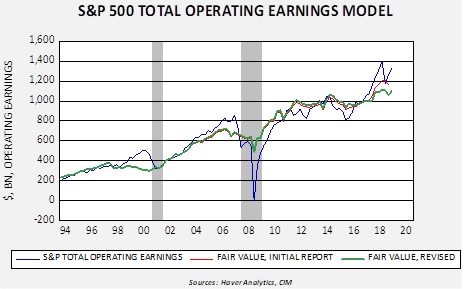
This chart is a model that estimates S&P operating earnings using the BEA profits data. The value of comparing the BEA profits data to S&P operating earnings is that it does give us a warning when earnings for the index are “frothy” and probably due to decline. In 2000 and 2006, S&P total operating earnings far exceeded the model’s fair value forecast and, as the recession approached, the index’s earnings fell to or exceeded the BEA-based model forecast.
Until the revisions, the S&P total operating earnings data was a bit high but not outside model ranges. The revisions now suggest that current operating earnings are high and will likely decline in the coming quarters. We still have other factors to take into account (the path of the divisor and the business cycle are two important ones) but, overall, earnings are likely to decline in the coming quarters.
[1] The GDP data comes from this effort.
[2] For reference, we use after-tax profits with inventory and depreciation adjustment.