

Asset Allocation Weekly (October 23, 2020)
by Asset Allocation Committee | PDF
The measures adopted to combat the spread of COVID-19 caused one of the most unusual recessions in American economic history. Although all recessions have their own unique characteristics, the recession that began in February was historically deep; it is likely already over too, making it one of the shortest on record. To a great extent, this is because this recession was caused by the disruptions due to the pandemic, not by the more usual factors, such as geopolitical events or monetary policy error. Business cycles are broken into three phases: recession, recovery, and expansion. The onset of recession is defined as the peak of the economy. The recession occurs during the decline in business activity and ends when the cycle troughs. The recovery begins at this point and lasts until the previous peak in business activity is exceeded, starting the next expansion. Given the deep initial decline in business activity, the recovery is now underway. Accordingly, economic analysis is now focused on the path of recovery. In this report, we are going to focus on how the pandemic has caused a services recession which will complicate the recovery.
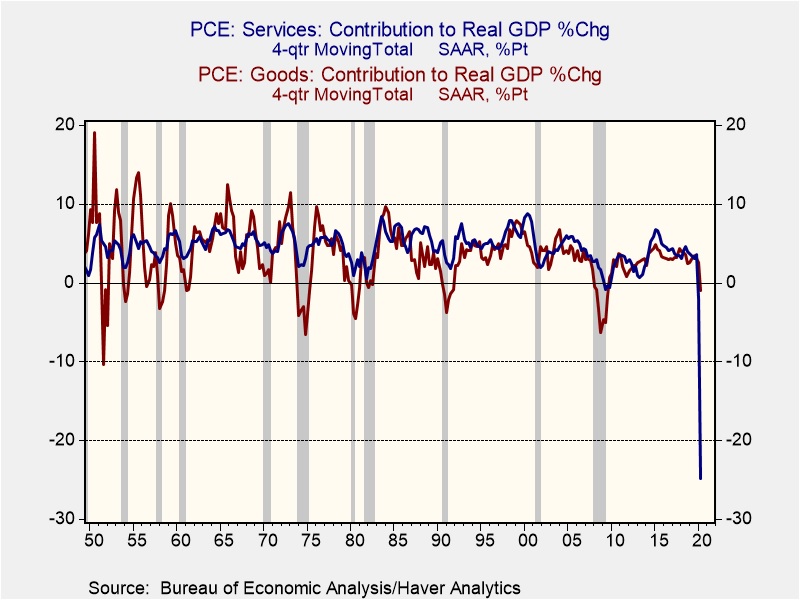
This chart shows the four-quarter sum of the contribution to GDP from services and goods consumption. In the 11 recessions that have occurred since 1950, a negative contribution from goods consumption has occurred in all but two (1970, 2001). A negative reading from services has only occurred twice, in the last two recessions. But, clearly this recession is unlike any in the postwar experience. Goods consumption has turned negative, but barely so; the decline in services, on the other hand, is unprecedented.
Because goods can be held in inventory, any lost sales in the near term can be facilitated in the future by providing the goods out of stockpiles. Eventually, inventory is exhausted and will need to be rebuilt. Last week’s AAW addressed this issue directly. One consistent factor we see in recoveries is that contribution from inventory, but services really can’t be inventoried. A forgone haircut or an evening at a restaurant won’t be recouped in the future. If one takes two cruises a year, it isn’t likely that one will take four in the first year of the vaccine; the two not taken will likely be lost consumption. Another way to consider this issue is that inventory in services is labor. Within the constraints of a restaurant, for example, the way one increases capacity is by hiring wait staff and cooks. To adjust to less traffic, the way a firm would reduce inventory is through layoffs.
At the same time, households are not just holding their savings; there has been a definite shift in spending—away from services and toward goods.
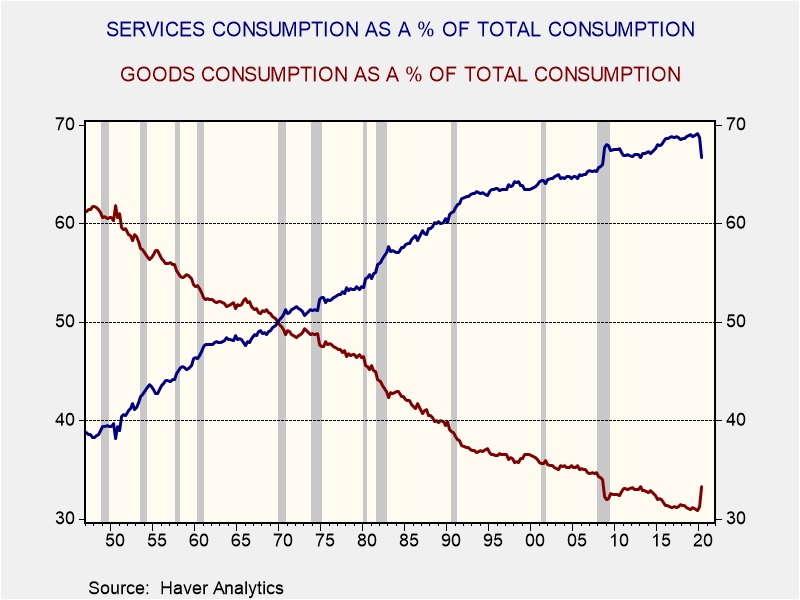
After WWII, goods consumption was just over 60% of all consumption, while services was just under 40%. By 1970, the two had equalized and, in Q4 2019, the divergence had made a new record—69.1% of consumption had gone to services and 30.9% to goods. Since then, goods have risen to 33.3% and services has declined to 66.7%. Although we would expect the secular trend to resume at some point, until a vaccine emerges and/or a reliable antiviral therapy is developed, the bias toward goods consumption will likely remain in place.
Given the likely overcapacity in services (as seen in the job losses in services industries), we would expect that the lack of demand will tend to act as an overhang on the economy and lead to a slow recovery. If we are correct in this assessment, it should keep monetary policy accommodative and inflation under control. As we will also show in this report’s accompanying chartbook, restaurants, gasoline, and recreation have suffered tremendous losses that will be difficult to recover from, while housing is getting a significant boost due to changes in office attendance.