

Asset Allocation Weekly (October 16, 2020)
by Asset Allocation Committee | PDF
Of all the different economic indicators published by the government and private entities, one of the least followed, but potentially very enlightening, is the Census Bureau’s monthly report on business inventories. The report tracks the value of inventories on hand each month at the retail, wholesale, and manufacturing levels and compares those values to the amount of sales at each level. The resulting inventory/sales ratio can help us predict business behavior in the coming months. For example, if the inventory/sales ratio is higher than normal, it may mean firms are saddled with excess stockpiles and will cut prices or hold back on new orders to their suppliers. When the inventory/sales ratio is lower than normal, it could portend increased orders and higher prices. The inventory/sales ratio fluctuates over time because of changes in technology and management practices, but it can still provide important insights over the short term.
As shown by the heavy blue line in the chart below, the overall inventory/sales ratio fluctuated between about 1.35 and 1.40 during the five years leading up to the coronavirus pandemic. When the pandemic shutdowns hit, many firms saw their sales plummet, leaving their inventories sitting on shelves in their shuttered stores or warehouses. The overall inventory/sales ratio surged to 1.67 in April. With the recent reopening of most of the economy, however, the overall ratio has now fallen to 1.33. Since the current ratio is lower than in the recent past, it may suggest firms would be eager to rebuild their stockpiles if they became more confident that the economic recovery will continue. Lean inventories may also encourage price hikes or discourage price cuts, helping to alleviate fears of excessively low inflation.
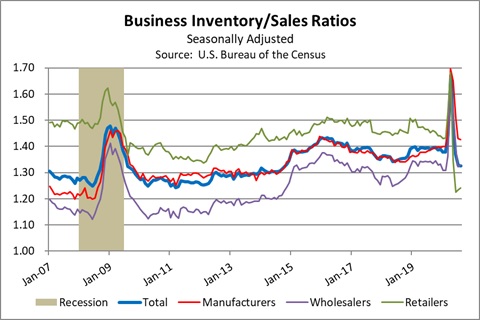
A close look at the detail in the chart is even more encouraging. Note that before the pandemic, retailers typically carried $1.45 to $1.50 of inventory for every dollar of monthly sales. In August, however, retailers had just $1.24 of inventory for every dollar of sales, marking their lowest inventory/sales ratio in at least 25 years. If you’ve finally started to go out shopping again after the lockdowns, you may have noticed that many stores have very little inventory on their shelves. In part, that may reflect retail managers’ lack of confidence in future demand. It could also be partly unplanned, reflecting an inability to get new inventories because of supply chain disruptions or reduced financing by skeptical lenders. In any case, it’s hard to believe retailers would keep their stockpiles this low when the economy returns to normal. Rather, one would expect an eventual inventory restocking and strongly rebounding orders.
In contrast with the situation for retailers, factory inventories are a bit high compared with recent history. Rather than carrying inventories worth $1.38 to $1.40 per dollar of sales, as they did before the pandemic, manufacturers recently had about $1.43 of inventory per dollar of sales. That means that if retail restocking leads to a rebound in manufacturing orders, there could be a modest delay in new production (since the wholesale inventory/sales ratio is right at its recent average, we are ignoring it for purposes of this analysis). All the same, it probably wouldn’t take long for the small excess in factory stockpiles to get used up. Manufacturers and raw material suppliers might need to ramp up production quickly, which in turn could require faster hiring. It’s probably too much to say the economy is a coiled spring ready to snap back to normal. We still think it will take some time to get over the drag from the pandemic. All the same, even a gradual normalization process could produce a big acceleration in factory activity, helping boost corporate profits and supporting further stock market gains.