

Asset Allocation Weekly (November 15, 2019)
by Asset Allocation Committee
The yield curve has steepened since the FOMC started cutting rates, raising hope that a recession can be avoided. In this report, we will examine whether these hopes make sense.
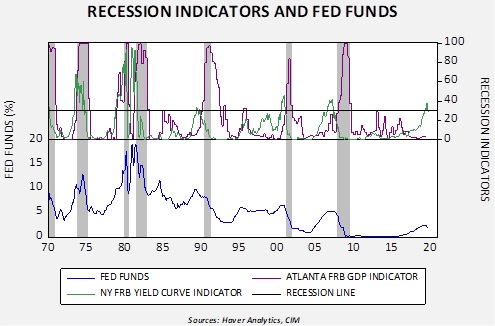
The above chart shows two recession indicators from two different regional Federal Reserve banks, Atlanta and New York. The former is a GDP-based indicator and the latter is based on the yield curve. The New York indicator is designed to signal economic activity a year into the future. We like to combine the two indicators because the Atlanta indicator tends to give false positives. However, in the past, when the New York indicator has moved above 30 followed by an Atlanta indicator rising above 40, a recession has been unavoidable.
Fed funds show us that easing doesn’t necessarily protect the economy from a downturn. Even though the FOMC has usually cut rates as the New York FRB indicator penetrated 30, it was not enough to fend off a downturn. Thus, even with the recent rate cuts, the risk of recession remains elevated.
The good news is that the Atlanta indicator is at a level where a recession isn’t imminent. The bad news is that the New York indicator has signaled a downturn is coming. Since the 1969-70 recession, the average lead time from the New York recession indicator has been 10 months, with a range of five to 15 months. Thus, by next spring, we could see evidence of a downturn. However, if we use the Atlanta indicator as a signal-confirming device, we should have a better idea of when a recession is actually underway. So, for now, investors should not become overly cautious but, by the end of Q1, increased vigilance will likely be warranted.