

Asset Allocation Weekly (November 13, 2020)
by Asset Allocation Committee | PDF
In our most recent Asset Allocation quarterly rebalance, we addressed the potential for election-related market disruption. In the end, we made only modest defensive adjustments to the portfolios and instead focused our allocations on continued policy support and economic recovery. In this week’s report, we will look at the current impact of the election on equity markets.
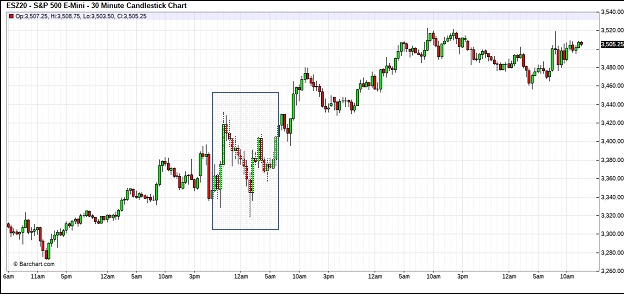
This is a five-day chart of the December S&P futures contract. We have placed a box on election night. Market volatility was clearly elevated as we saw sizable rallies and pullbacks. But, for the rest of the week, equity prices have continued to recover.
One of the questions we have been getting is, given all the turmoil and uncertainty, why are equities rising? The key point is that equities were pricing in some element of a “tail risk” outcome—a hung election and widespread civil unrest. Media reports that retailers were boarding up windows suggested that these concerns were not idle. Gun sales were at historic levels going into the election. So, clearly, fear levels were high.
One of the more difficult issues for a young analyst is understanding the discounting power of financial markets. In many respects, financial markets account for the sum of our fears. And so, it is not uncommon that even when an event occurs as expected, financial market prices will reverse from what a casual observer would assume would occur. The adage is “buy rumor, sell fact.” In the spring, when we first began investigating the potential for a hung election and a Constitutional crisis, the topic was still rather obscure. By Labor Day, it had become “common knowledge.” When an issue becomes common knowledge, financial markets quickly discount the event.
Although equities generally held their value through the election (prices peaked around Labor Day and were rangebound thereafter), there were two areas where there was clear evidence of risk mitigation. The first was accumulation of cash.
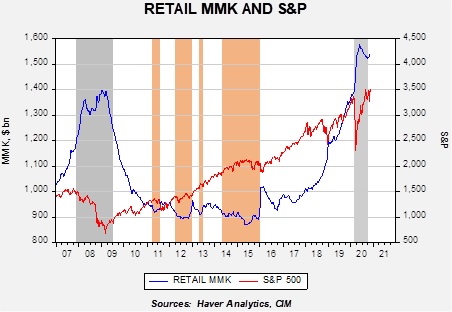
This chart shows retail money market funds (RMMK) and the S&P 500 on a weekly basis. Retail investors started building cash positions in 2018 around the onset of trade tensions with China and aggressively added to cash this year. Although RMMK did ease with the recovery in the S&P, levels remain elevated and suggest high levels of fear. If we get through the election without significant civil strife, there is ample liquidity to support equities.
The second area was volatility futures.
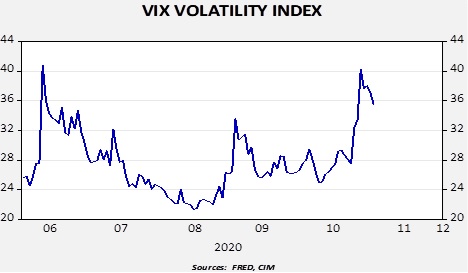
The “VIX” is a measure of implied volatility from the S&P 500 options market. When option buyers pay higher prices for options, it gets translated as higher implied volatility. Essentially, if they are buying put options, they are protecting for a wider dispersion of prices. This chart shows daily prices for the index; in the third week of October, the VIX rose sharply as the election approached, suggesting rising levels of fear.
If the worst of the election risk has passed, these “insurance” positions will likely be unwound. If so, that would tend to support higher equity prices in the coming months. In other words, the return of cash to the markets and the reduction of put-buying would be supportive.