

Asset Allocation Weekly (March 9, 2018)
by Asset Allocation Committee
Last year, we introduced an indicator of the basic health of the economy and added it to the many charts we monitor in gauging market conditions. The indicator is constructed with commodity prices, initial claims and consumer confidence. The thesis behind this indicator is that these three components should offer a simple and clear picture of the economy; in other words, rising initial claims coupled with falling commodity prices and consumer confidence is a warning that a downturn may be imminent. The opposite condition should support further economic recovery.
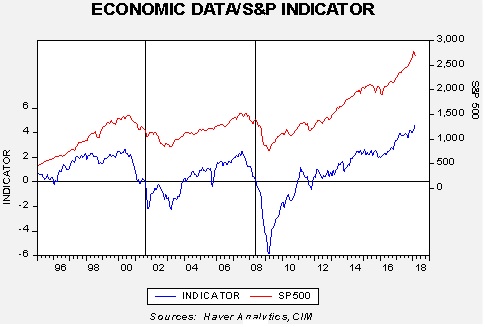
This chart shows the results of the indicator and the S&P 500 since 1995. We have placed vertical lines at certain points when the indicator falls below zero. Although it works fairly well as a signal that equities are turning lower, there is a lag. In other words, by the time this indicator suggests the economy is in trouble, the recession is likely near or underway and the equity markets have already begun their decline.
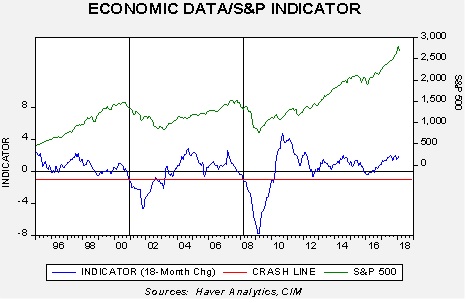
To make the indicator more sensitive, we took the 18-month change and put the signal threshold at -1.0. This provided an earlier bearish signal and also eliminated the false positives that the zero threshold generated. Notwithstanding, we will pay close attention when the 18-month change approaches zero.
What does the indicator say now? The economy is healthy and currently supportive for equity markets. Future market performance is likely to be more affected by the P/E multiple rather than earnings, which are dependent on economic growth. The P/E is mostly a function of interest rates and inflation, although there is also an element of sentiment to the ratio. For now, we expect the multiple to remain elevated but the risk of contraction will grow over time, especially if inflation worries increase. We will have more to say on this issue in the coming weeks.