

Asset Allocation Weekly (March 5, 2021)
by Asset Allocation Committee | PDF
In our 2021 Outlook, we had a forecast for the S&P 500 of 3918/4050. Since the index is close to that level, we have received questions about whether we are expecting little upside from here or if we intend to calibrate our expectations. This week’s Asset Allocation Weekly is a preliminary look at what we intend as an update of our forecast.
Optimism surrounding economic growth in 2021 is rising rapidly. A number of private economists have dramatically upgraded their forecasts. The Atlanta FRB’s GDPNow forecast for Q1 is estimating real GDP at 9.5%. We do expect that growth estimate to decline from these levels (e.g., rising consumption will lift imports, which are a drag on GDP), but a reading above 5% is clearly possible. There are two factors driving optimism; the first is that the virus appears to be coming under control. The combination of widespread infections and increasing vaccinations means the U.S. is probably achieving some degree of herd immunity. Although caution won’t be necessarily thrown to the winds, a steady relaxation of restrictions will boost services consumption. Second, fiscal spending will tend to boost the economy.
This optimism could be misplaced. The virus could mutate into a form that renders current vaccines less effective. Even after the risk of infection has been reduced, it still may take some time for fear to be reduced. It should also be noted that much of the fiscal spending is direct transfers to households instead of the government purchasing goods and services. Although this aid may be spent, we would not be shocked to see some of these funds used for debt reduction or saving. After all, inflation has been low, households are still over leveraged, and many households are in arrears over rent or mortgage payments. It isn’t certain that this optimism is appropriate, but for now, the financial markets are leaning in that direction. So, what do we know so far?
We are seeing a drift away from sectors that benefited from the pandemic to those who will do better in recovery. The easiest way to see this is by comparing the S&P 500 to its equal-weighted compatriot.
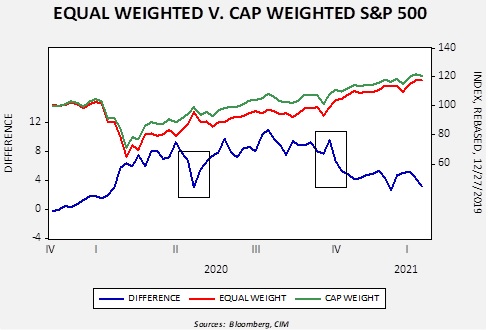
In the long run, the equal-weighted index outperforms the capitalization-weighted index. For example, from 1990 through 2020, the former rose at a compound annual growth rate of 14.3%. Over the same time frame, the latter rose 12.5%. However, there are occasions when the capitalization-weighted index outperforms. For example, during the tech bubble, it did better than the equal-weighted index. It also outperformed during the pandemic. As the above chart shows, as equities fell due to the pandemic shutdown, the capitalization-weighted index did better. The difference line on the lower part of the graph, which represents the spread between the capitalization-weighted index and the equal-weighted index, widened in favor of the former. We have put two boxes on the chart. The first, which shows the late second quarter, shows the spread narrowing as the economy recovered. The second box is the period after the election. After the election, optimism over additional fiscal stimulus rose. In general, what we are seeing is that the equal-weighted index tends to perform better in the currency cycle when economic expectations improve.
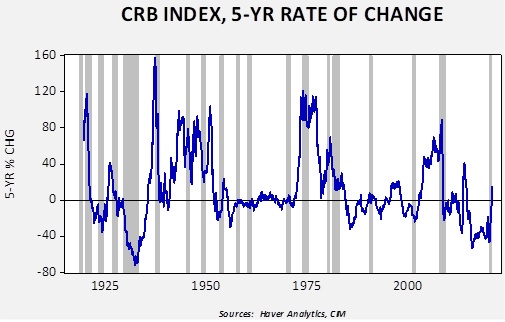
Commodity prices are rising. The five-year change in the CRB index is rising rapidly.
The yield curve is steepening.
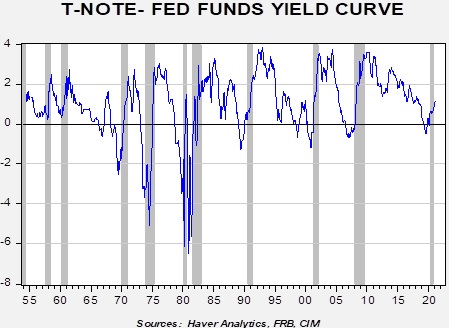
This chart shows the spread between the 10-year T-note and fed funds. Inversions (a reading less than zero) is a consistent indicator of recession. As this curve steepens, note that in the last four business cycles, the spread exceeded 200 bps. If this were to occur again, the 10-year T-note yield would exceed 2.00%.
So, what does this all mean? First, we might be in a situation where the S&P 500 doesn’t move much higher from here but sectors and areas of the market that have lagged show improvement. Investing performance may be less about owning an index than focusing on other areas of the market. Second, areas outside of stocks are poised to do well―commodities, for example. Third, the risk to equities probably comes from rising interest rates. At the same time, not all parts of the equity market struggle with higher rates, and these areas should show promise.