

Asset Allocation Weekly (March 22, 2019)
by Asset Allocation Committee
One factor we have been tracking is the recent behavior of retail money market funds. We have noted that households began building money market funds about the time that the equity market peaked and U.S. trade policy began to turn toward protectionism. In the coming months, money market funds continued to rise even as the S&P 500 made new highs. However, as equity markets fell in Q4, money market funds rose rapidly, with the pace of the increase rivaling what we saw in 2007-08.
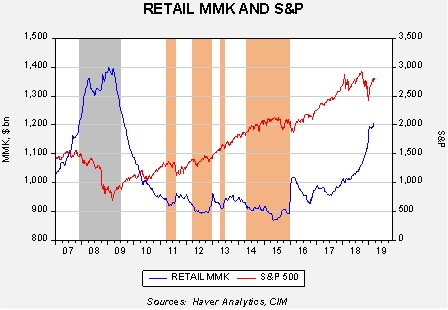
This chart shows retail money market funds and the S&P 500. The gray shaded area shows the 2007-09 recession. The orange shaded areas show periods when money market funds fell below $920 bn. When money market funds fell to those levels, equities tended to stall. In recent weeks, the pace of increases in retail money market funds has slowed but still continues to rise, even with the market’s recovery. It may be difficult for equities to move much higher without retail participation.
In light of this analysis, which we have been discussing on a regular basis, another thought emerged—what is the role of cash in a portfolio? To examine this issue, we decided to look at cash instruments in the holdings of households.
It turns out that cash has a complicated history.
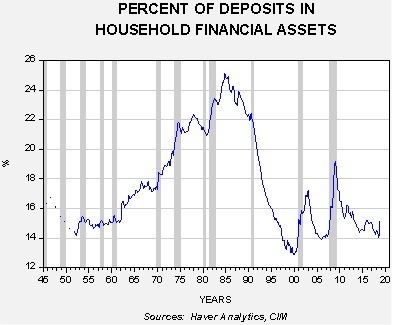
This chart shows the percentage of deposits in household financial assets. From the early 1950s into the early 1980s, the level of deposits generally rose. This rise was probably due to a number of factors. During this period, there was a steady rise in household income; at the same time, the financial system was heavily regulated. Regulations limited households’ flexibility in investing. However, by the mid-1980s, Regulation Q, which put caps on deposit rates, was removed. And, the financial services industry greatly expanded the products available and improved the logistics of investing. Financial deregulation increased the access to borrowing for households; thus, the need to save for purchases diminished. Income inequality also rose after 1979, which likely concentrated saving into fewer households. With more liquidity, these high income households were more likely to look for other investment opportunities. Essentially, the bull market in stocks that began in the early 1980s and ended in 2000 was supported by a more than 10% point decline in the share of deposits in household accounts.
Household deposits function as an investment, a way to smooth out spending and a flight to safety instrument. Thus, one would expect there to be a close relationship between consumption and deposits and a rise in deposits relative to consumption during periods of crisis. In fact, these features do exist, but there was a significant break in the relationship starting in 1990.
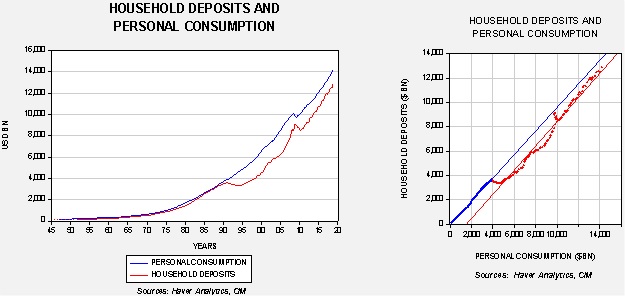
The chart on the left shows the time series of personal consumption and household deposits; the one on the right shows a scatterplot with regression lines. Note that after 1990, the relationship curve shifted to the right, meaning that fewer deposits were required to support consumption. Deposits rose sharply in 2005, even faster than consumption. That was when the housing crisis began and there was clearly a flight to safety.
Since 2005, there has been a steady increase in deposits relative to consumption, which would suggest a generalized increase in fear relative to the period from 1995 to 2005.
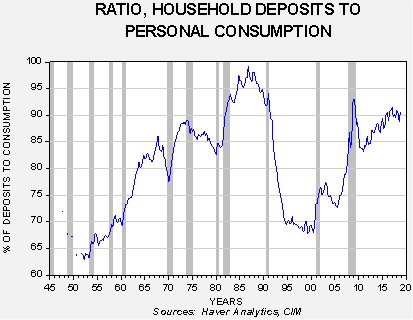
This chart shows the ratio of deposits to consumption. In 2000, deposits fell below 70% of consumption. The ratio rose after that and has currently reached 90%. Note how fast the ratio rose after housing peaked in 2005—there was a clear flight to cash that culminated in the Great Financial Crisis. That level of fear has persisted, shown by the high level of deposits relative to consumption.
In conclusion, as the first chart shows, we have seen a lift in money market funds. This does suggest an elevated level of fear in financial markets. However, the recent rise should be viewed within the context of overall cash holdings in households. Essentially, households are holding high levels of deposits relative to consumption, suggesting rather high levels of caution already. We still believe that retail money market funds need to decline in order to see equities rise this year; however, it also seems that households are not as complacent as they were in 2005 and therefore the likelihood of a financial crisis is probably not very high.