

Asset Allocation Weekly (March 15, 2019)
by Asset Allocation Committee
The Financial Accounts of the United States, formerly known as the Flow of Funds Report, was released last week. It is a plethora of information about the state of the economy. Below we discuss the charts we find most noteworthy.
First, here is the saving balance by sector.
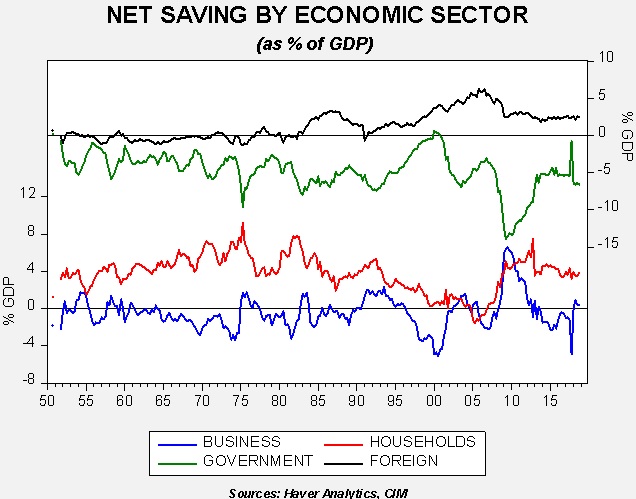
The tax cut has led to an increase in business saving and a wider fiscal deficit. Household and foreign saving was essentially unchanged. We are watching to see if the administration’s trade policy reduces the trade deficit; if it does, then foreign saving, the inverse of the trade deficit, will decline and require higher saving from the other three sectors to offset that saving decline.
Second, the share of national income going to capital and labor were mostly stable.
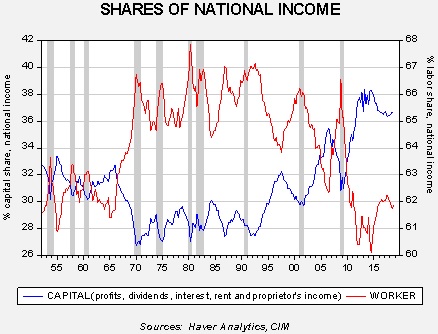
Since the end of communism in the early 1990s, capital has been taking a steadily larger share of national income. In each expansion, the capital share has made a higher peak.
Third, the drop in equity markets adversely affected household net worth.
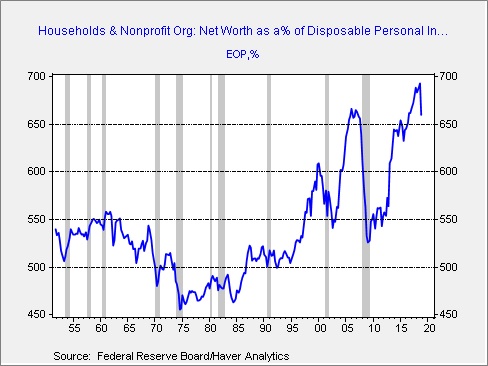
Net worth relative to after-tax income took a dive in Q4; the recent recovery in equity markets should reverse this dip, but we do note that in previous cycles such declines tended to signal that the business cycle was coming to a close.
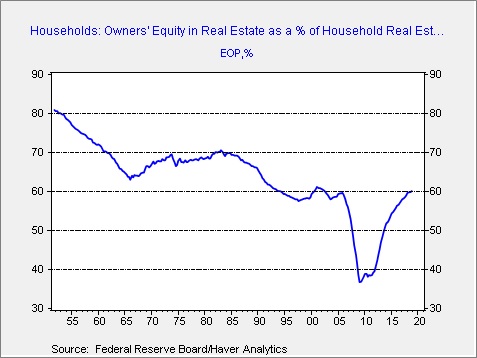
Fourth, owners’ equity in real estate finally reached 60%, a level which we consider normal. This was the level the market was at pre-1995, when the government eased the rules on home ownership. During the real estate crisis, equity plunged as falling home prices collided with excessive mortgage debt. From a financial perspective, this suggests the residential real estate market has overcome the trauma of the Great Financial Crisis.[1]
Finally, household deleveraging is continuing, although the pace has slowed.
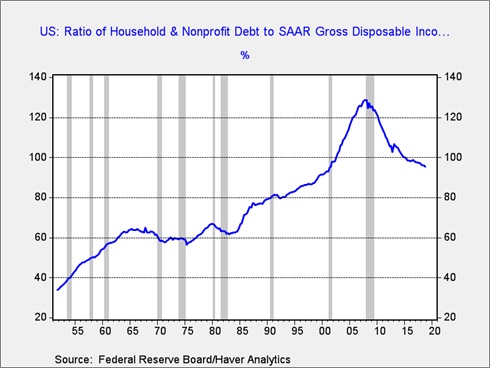
This chart shows household debt as a percentage of after-tax income. From the early 1980s into 2005, household debt rose steadily. The Great Financial Crisis led households to lower their debt levels relative to income. Although there is no generally accepted level that signals when deleveraging has been achieved (we would prefer around 80%), the continued decline is both good and bad. It is good because the reduction in debt is supportive for household balance sheets. However, growth will tend to be slower during periods of deleveraging.
Overall, the report does show the tax bill affected business saving and government dissaving. The recent market decline was reflected in the slide in household net worth. Capital is still gaining on labor; the housing market is now on a more solid footing compared to a decade ago. And, household balance sheets are improving. Overall, we view the report as consistent with steady, slow growth.
[1] This is only true for the financial system. Many communities are still struggling with the aftermath of the crisis.