

Asset Allocation Weekly (June 7, 2019)
by Asset Allocation Committee
Monetary policymakers are facing divergent trends that complicate future policy actions.
Financial markets are signaling that the policy rate needs to be cut immediately.
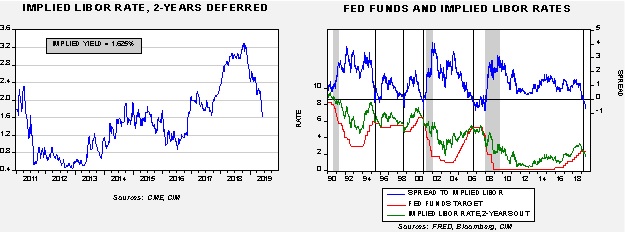
The chart on the left shows the implied three-month LIBOR rate, two-years deferred, from the Eurodollar futures market. Last October, the implied rate was around 3.30%; it has fallen sharply to 1.625%, a decline of nearly 70 bps. The chart on the right compares that implied rate to the fed funds target. History shows the Fed has tended to cut the target rate when the implied rate inverts relative to the policy rate (shown on the upper line). The spread has widened considerably, meaning the Fed should be moving to cut rates soon. This data would suggest the longer policymakers wait, the higher the probability of a recession.
Current economic conditions probably don’t warrant a rate reduction.
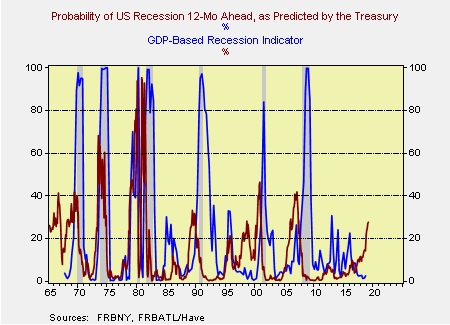
This chart shows the NY FRB recession indicator, which projects the odds of recession 12 months out and the Atlanta FRB GDP-based recession indicator. In general, combining the two indicators reduces the chance of a false positive, namely, predicting a recession that doesn’t occur. We use the 20% threshold as a warning sign; if both indicators are above 20% then a recession warning is warranted. The only false positive that was triggered with the 20% threshold was in 1995 and that event was considered a rare “soft landing.” As the first chart shows, in 1995, the Greenspan Fed did cut rates and this action probably extended the expansion. The current reading of these two indicators suggests caution, but the economic data is not signaling that a downturn is imminent. And, as a cautionary tale, we had a similar configuration in the data in 1997-98. The Fed did ease in that event, in part driven by the LTCM Crisis, and that easing is often blamed for stoking the tech bubble in 1999.
Inflation remains controlled, but tariffs could affect prices.
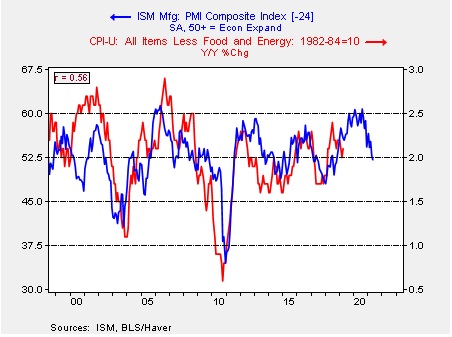
This chart compares the ISM Manufacturing Index to core CPI. The ISM index tends to lead inflation by two years. Comparing core CPI to the ISM Manufacturing Index suggests that inflation might lift in the coming months but should not overshoot by a wide margin. However, it is important to note that tariffs are a form of consumption tax. While the incidence of the tax does not automatically fall to the consumer (the producer or importer could absorb the cost, cutting profit margins, or the dollar could appreciate and offset the tariff), there is the possibility of an unexpected rise in inflation.
These three issues will likely keep the FOMC on hold in the near term. If that analysis is correct, the chances of recession will tend to rise in the coming months.